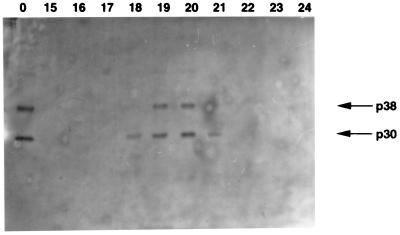
Figure 3.
Immunoblot using ThLo serum of S-12 fractions that spanned the peak of RNase P activity eluted from the column. Molecular weight markers were run in the gel but are not shown in the figure. The markers were used to determine the approximate molecular weights of the species indicated in the figure. Lane 0 refers to the sample (from the Mono Q column) loaded on the S-12 column and the other lanes refer to fractions eluted from the column: the peak of RNase P activity was in fractions 19 and 20.

