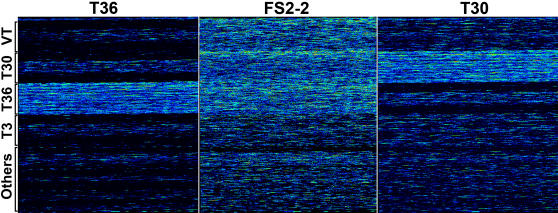
Figure 2. Images of hybridized resequence microarrays.
The Affymetrix CTV Microarray chips were hybridized with the target DNA indicated at the top of each panel. Hybridized microarrays were scanned at a resolution of 1.5 µm per pixel. Warm colors represent higher hybridization intensities and cool colors represent lower hybridization intensities. Locations of CTV genomes tiled on the microarray are indicated to the left. Single genome blocks are hybridized with T36 and T30 target DNA while multiple genome blocks are hybridized with FS2-2 target DNA.

