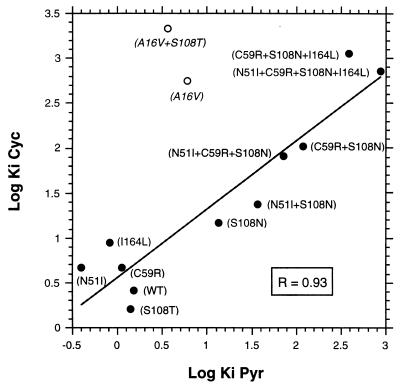
Figure 2.
Correlation of Pyr and Cyc resistance among DHFR mutants. The log Ki values for Pyr were plotted against the log Ki values for Cyc. Mutants and amino acids mutated were indicated. Data were analyzed by a linear regression fitting program. Mutants indicated by open circles and italicized names were not included in the analysis.

