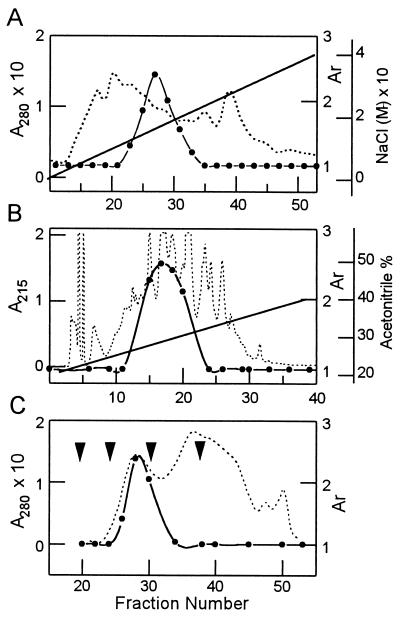
Figure 1.
Chromatographic separations of PTTH. Solid line denotes gradient, solid circles PTTH activity recovered, and broken line absorbance. (A) Ion-exchange chromatography using an S-Sepharose column. The column was eluted with a linear gradient of 0–0.4 M NaCl in a 0.05 M sodium acetate buffer (pH 5.6). PTTH activity was recovered from fractions eluted with a gradient of 0.12–0.16 M NaCl. (B) RPHPLC using a C18 column. PTTH was eluted with a linear gradient of 20–40% acetonitrile in 0.05% TFA for 60 min at 25°C at a flow rate of 1 ml/min. (C) Gel filtration chromatography using a Superdex G-75 column. The 45-kDa PTTH was eluted in fractions 27–31, each fraction being 2 ml. First arrow denotes void volume, second arrow the fraction where bovine serum albumin (66.8 kDa) eluted during column calibration, third arrow the fraction where carbonic anhydrase (29 kDa) eluted during column calibration, and fourth arrow where cytochrome c (12.4 kDa) eluted during column calibration. Activation ratio (Ar) = The quantity of ecdysone synthesized by the ring glands in Grace’s medium with PTTH/The quantity of ecdysone synthesized by the ring glands in Grace’s medium alone (control)

