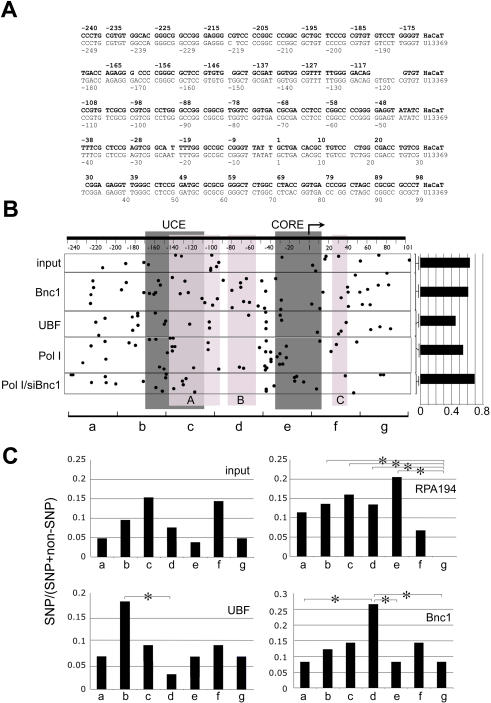
Figure 5. Single nucleotide polymorphism (SNP) in HaCaT rDNA promoters.
A, A consensus DNA sequence of HaCaT cell rDNA promoters. The consensus (in bold letters) was deduced from the sequence of 181 HaCaT rDNA promoter clones, which were obtained from PCR-amplified rDNA promoters. Twenty-one of the clones were obtained directly from genomic DNA, the rest were isolated from ChIP DNA precipitated by anti-basonuclin (49 clones), anti-UBF (44 clones), anti-RFA194 in the presence (44 clones) and absence of basonuclin (23 clones). A human rDNA promoter sequence (U13369) is listed below the HaCaT consensus. The two sequences are aligned according to their transcription start site (+1). B, A tabulation of SNPs in various ChIP groups. A generic rDNA promoter is depicted at the top with transcription start site (bent arrow), and the cis elements (dark gray boxes) indicated. UCE, up-stream control element and CORE, the core element. Nucleotide coordinates are shown below the DNA. The three basonuclin binding sites (light gray boxes labeled A, B, C) are indicated. SNPs are depicted as dots. The horizontal position of each dot indicates its location in the rDNA promoter, and its vertical position, the ChIP groups as indicated on the left. Input, a collection of randomly picked genomic rDNA promoters, Bnc1-, UBF- and RPA194- (Pol I) associated promoters; Pol I/siBnc1, RPA194-associated promoters in basonuclin-deficient cells. Not all clones contained SNP and the percentage of SNP-containing clones in each ChIP group is shown by a histogram on the right. For a statistical analysis of the SNP frequency, see Table 1. C, For analyzing the regional SNP variations, the promoter is divided into seven 50-base non-overlapping regions, which were named alphabetically, as indicated at the bottom of (B), a, −250 to −201, b, 200 to 149, etc. The regional SNP frequencies are plotted for the input and three ChIP groups, RPA194, UBF and Bnc1. Statistically significant differences are indicated (*, p<0.05).

