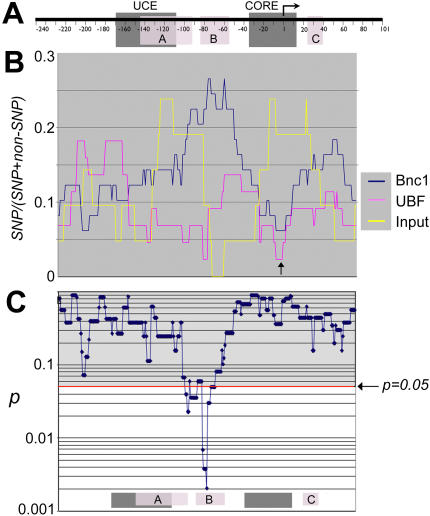
Figure 6. A comparison of the local SNP frequencies in rDNA promoters.
A, Depicted is a generic rDNA promoter, to which graphs in B and C are aligned. B, The frequency of SNP was scored by scanning the promoter sequence with a 50-base window. The scores are expressed as the ratio of SNP/(SNP+non-SNP). Each SNP score is aligned to A, using the center nucleotide of each window. Shown are SNP scores of three promoter sets: Bnc1, UBF and the input. An arrow indicates the low SNP frequency near the transcription start site in basonuclin- and UBF-associated promoters, but not in the input. In C, a series of pair-wise chi-square tests were performed on the corresponding SNP frequencies of basonuclin- and UBF-associated promoters. The resulting p values are plotted in alignment with A and B. As a reference, the positions of cis-elements as well as basonuclin binding sites are shown at the bottom of panel B.

