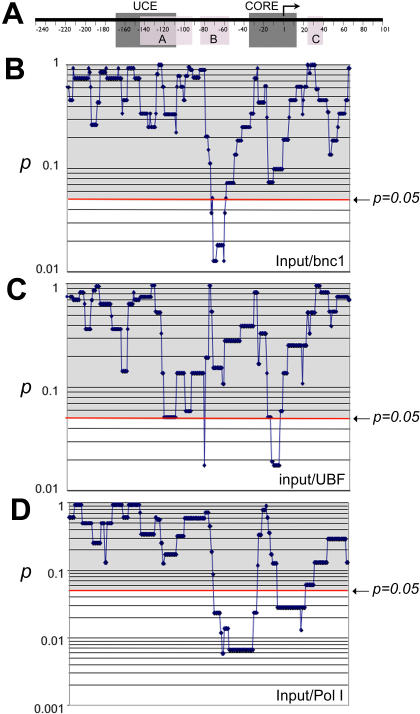
Figure 7. A statistical pair-wise comparison of local SNP frequency between the randomly picked genomic rDNA promoter and the promoters associated with basonuclin, UBF, or RPA194.
A, a generic rDNA promoter, to which all the other panels (B, C, D) are aligned. The notations on the rDNA promoter are as described in Fig. 5A. In panel B, C, D, p values were calculated by a chi-square test and plotted. The notation and graphic depictions are as described in Fig. 5B. B, input vs. basonuclin, C, input vs. UBF, D, input vs. RPA194.

