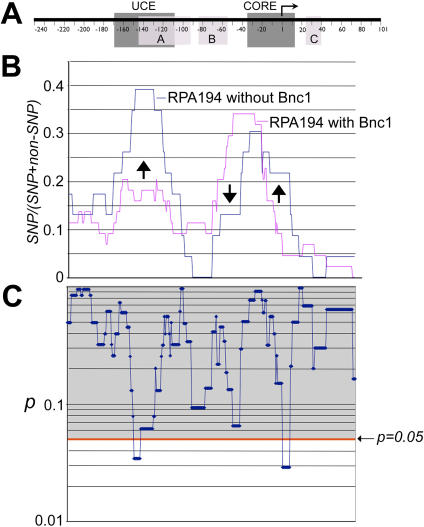
Figure 8. A comparison of RPA194-associated promoters in the presence and absence of basonuclin.
A, A generic rDNA promoter is depicted as described in Fig. 5. B, SNP frequencies of RPA194-associated promoters are plotted as described in Fig. 5. Arrows show the region as well as the direction of changes caused by basonuclin-deficiency. C, Pair-wise chi-square tests on SNP frequencies shown in B were performed. The resulting p values are plotted in alignment with panels in A and B. The notations are as described in Fig. 4 and 5.

