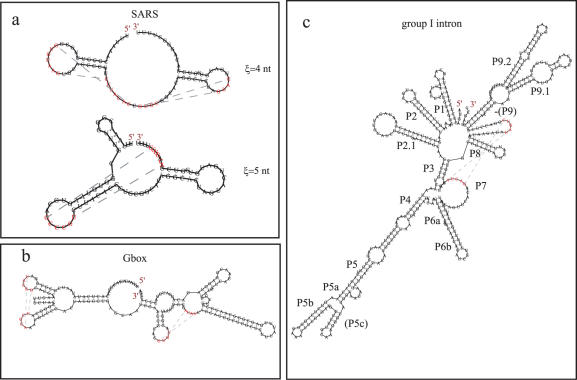
Figure 2. Other examples of pseudoknot predictions.
(a) The frame shift sequence of the SARS corona virus for two different Kuhn lengths: ξ = 4 nt and ξ = 5 nt. The measured structure is closer to ξ = 5 nt. (b) G-box structure predicted for the full sequence: Kuhn length ξ = 4 to 5 nt with the effective Flory option, δ∼1.6, and other parameters default. (c) T. thermophila Group I intron structure predicted for the full sequence: ξ = 10 nt, using effective Flory with settings δ = 1.4 and γ = 1.5; where ‘P’ indicates known pairing, (..) indicate some prediction errors, and ‘-(..)‘ indicates missed in the prediction.

