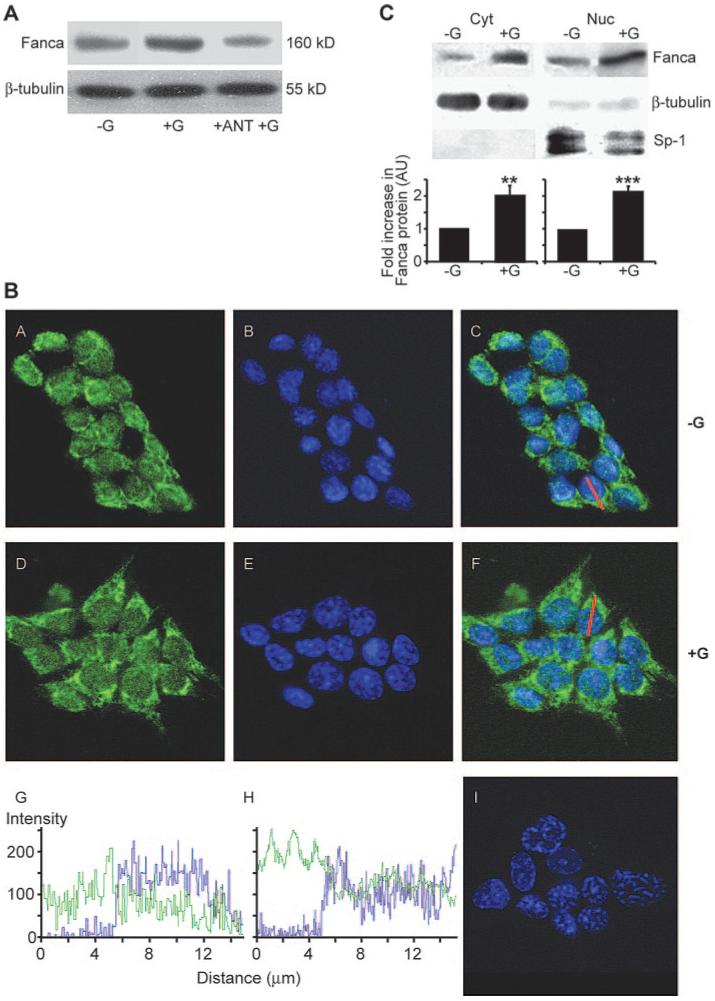
FIG. 1.

Endogenous FANCA is located across the nucleocytoplasmic compartment in LβT2 cells. A, LβT2 cells were pretreated with GnRHR antagonist 1 μm Cetrorelix (ANT) before treatment for 2 h with 1 μm GnRH. Western blotting analysis of wholecell extracts identified that addition of ANT blocked the GnRH-induced increase in FANCA. A representative gel, of two performed, is shown. B, Confocal microscopy analysis of untreated (−G) and GnRH-treated (+G; 1 μm for 2 h) LβT2 cells. Anti-FANCA antibody immunostaining, followed by biotin-conjugated goat antirabbit is shown in green in panels A and D, nuclei were stained blue with 1:2000 Topro-3 (panels B and E). FANCA immunostaining merged with Topro-3 is shown in panels C and F. Panel I shows the pattern if anti-FANCA antibody is omitted. A cross-sectional line was drawn through a representative cell in panels C and F. The intensity of the pixels that fall on the line were plotted against distance (micrometers) and are shown for each channel, FANCA in green and Topro-3 in blue, in panels G(−G) and H (+G). Zero equals no signal, whereas 256 is the maximum detectable level. C, Detection of FANCA in nuclear (Nuc) and cytoplasmic (Cyt) compartments using Western blotting analysis. Cells were either left untreated (−G) or treated (+G) with 1 μm GnRH for 2 h. Seventy-five micrograms of Nuc or Cyt protein extract were immunoblotted for FANCA and then reprobed for nuclear marker, Sp1, and cytoplasmic marker, β-tubulin. A representative blot is shown; the graph represents the average ± sem increase in FANCA calculated from three separate experiments. Protein levels were quantified using a Storm PhosphoImager and untreated extracts were assigned a value of 1. One-way ANOVA established statistical significance of GnRH treated vs. untreated as **, P < 0.01 and ***, P < 0.001.
