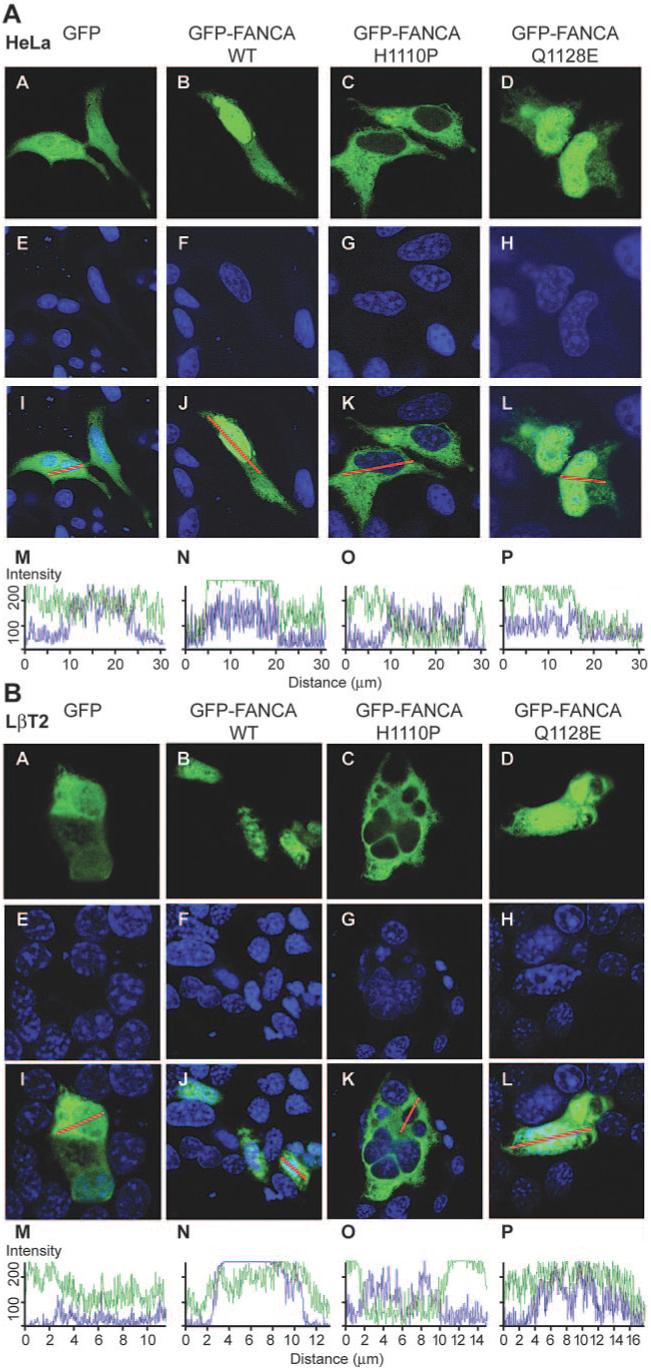
FIG. 5.

Effect of amino acid substitutions on the nucleocytoplasmic localization pattern of GFP-FANCA. HeLa (A) and LβT2 (B) cells were transfected with GFP-empty vector (A), GFP-FANCAWT (B), GFP-FANCAH1110P (C), or GFP-FANCAQ1128E (D) and then examined using confocal microscopy. Torpro-3 staining was used to visualize the nuclei of fixed cells (E-H), and the merged images show an overlay of the two (I-L). A representative merged cell was chosen (I-L), transected, and the intracellular location of GFP (green) and Torpro-3 (blue) fluorescent intensities shown graphically (M-P). The intensity ranges from zero to a maximum of 256 and measures how many pixels hit the line for each individual channel.
