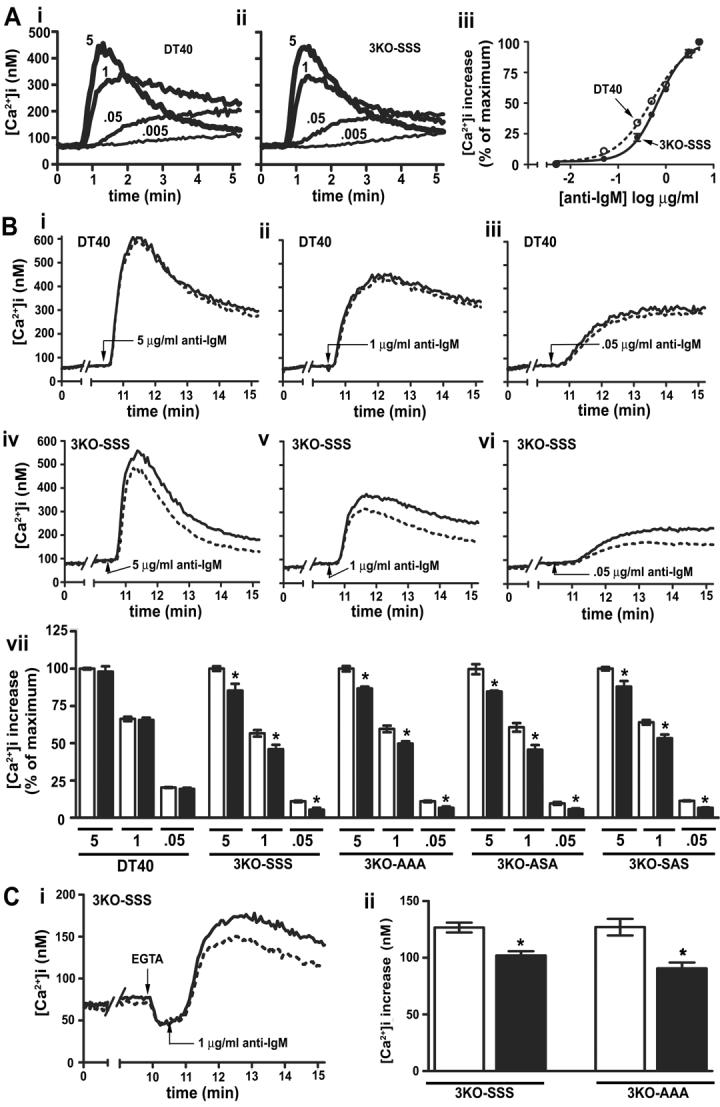
Figure 4. Effect of PKA activation on IP3R3-mediated Ca2+ mobilization in response to BCR stimulation.

(A) Traces of typical Ca2+ responses to 5, 1, 0.05 and 0.005 μg/ml anti-IgM (added at t = 0.5 min) in DT40 (i) or 3KO-SSS (ii) cells. Dose-response curves (iii) for DT40 and 3KO-SSS cells are expressed as a percentage of the [Ca2+]i increase in response to 5 μg/ml anti-IgM. Error bars may be occluded by symbols. (B) Traces of typical Ca2+ responses in DT40 (i-iii) or 3KO-SSS (iv-vi) cells exposed to 5 (i and iv), 1 (ii and v), or 0.05 (iii and vi) μg/ml anti-IgM (added at t = 10.5 min) in the absence (solid line) or presence (broken line) of 1 μM forskolin plus 200 μM IBMX (added at t = 0.5 min). Histogram (vii) of [Ca2+]i increases in DT40 or 3KO cell lines in response to 5, 1, or 0.05 μg/ml anti-IgM in the absence (clear bars) or presence (solid bars) of forskolin plus IBMX. (C) Typical traces of Ca2+ responses in 3KO-SSS cells (i) exposed to 5mM EGTA (added at t = 10 min) and 1 μg/ml anti-IgM (added at t = 10.5 min) in the absence (solid line) or presence (broken line) of 1μM forskolin plus 200 μM IBMX (added at t = 0.5 min). Histogram (ii) of [Ca2+]i increases in 3KO-SSS and 3KO-AAA cells in the absence (clear bars) or presence (solid bars) of forskolin plus IBMX.
