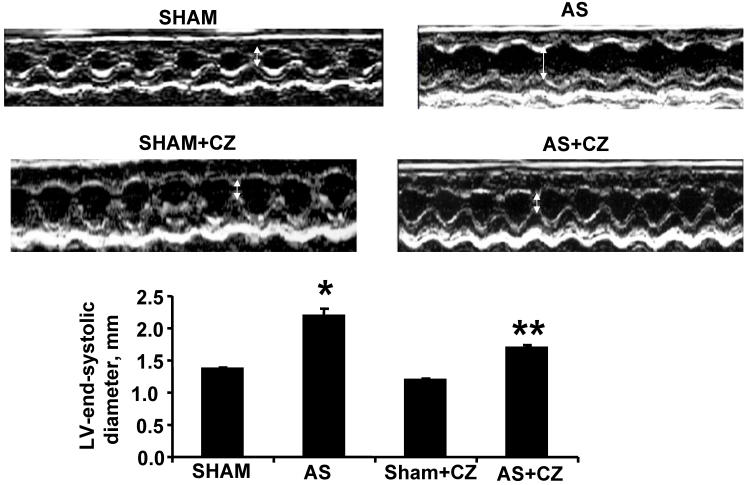
Figure 7.
M-mode echocardiography of sham, AS, sham+CZ and AS+CZ hearts. The white arrow indicates the LV end systolic diameter. Note arrow is bigger in AS than other groups. The bar graph represents the LV end systolic diameters of sham, AS, sham+CZ and AS+CZ mice. *p<0.05 compared to sham; ** p<0.05 compared to AS; n=6 in each group.

