Fig 4.
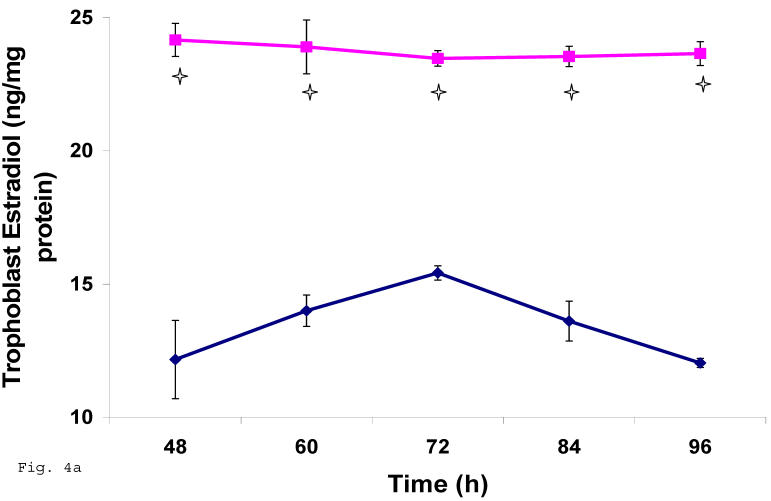
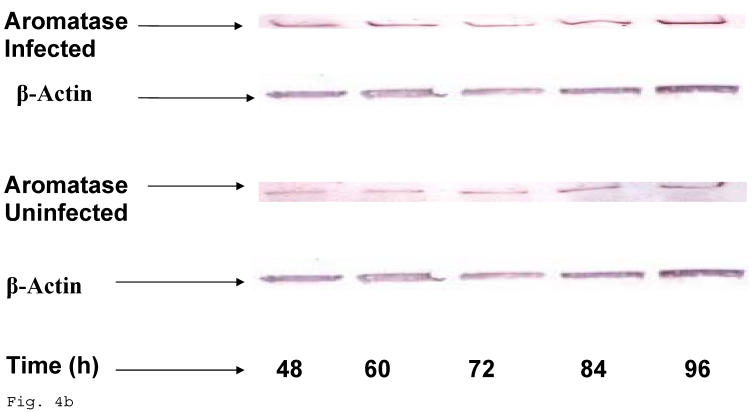
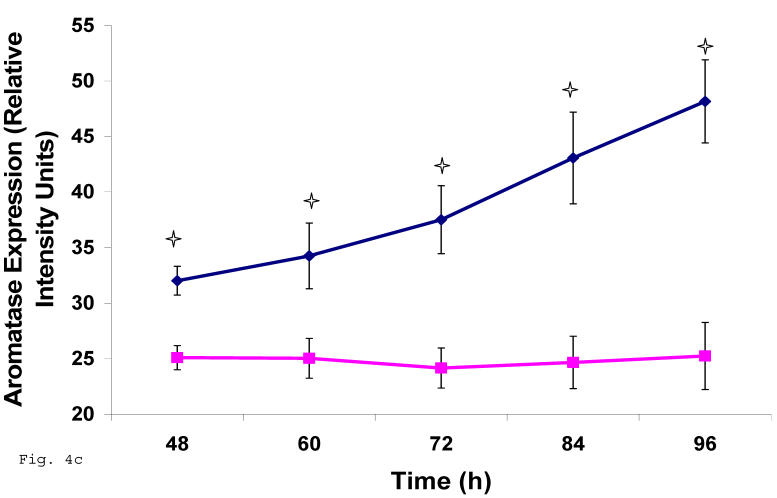
Induction of estradiol down-regulation in Chlamydia trachomatis infected trophoblast. The cellular estradiol level of infected trophoblast (-♦-) compared with uninfected cells (-■-) is depicted (A). There was significant decline in estradiol production (p < 0.01 * ) in infected trophoblast. The time-course level of aromatase production is represented in B & C. There was a significant increase in expression of the enzyme (p < 0.05 *) in infected trophoblast (-♦-) compared with uninfected trophoblast (-■-). All values represent means ± SEM (n = 3).


