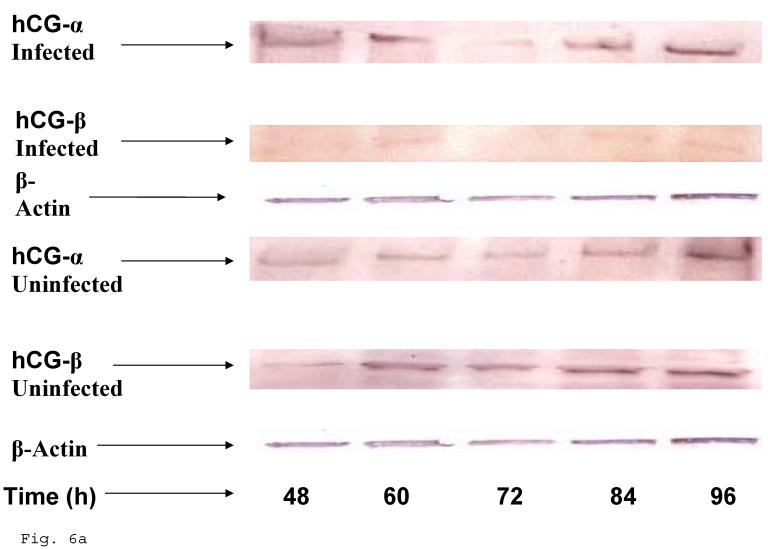
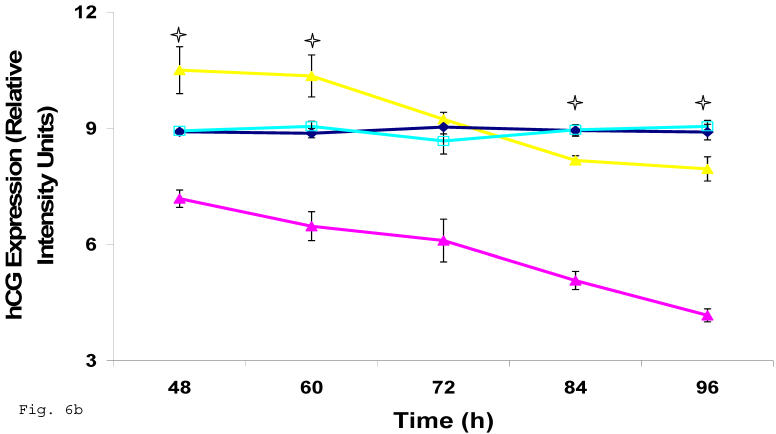
Fig 6.
Down-regulation of hCG in Chlamydia trachomatis infected trophoblast. The effect of Chlamydia trachomatis on trophoblast hCG production during infection is depicted as hCG protein expression (A and B). Panel A shows reduction in β-hCG in infected trophoblast compared with uninfected cells. Less change was recorded in α-hCG. There was a significant decline (p < 0.05 *) in β-hCG production (B) in infected trophoblast (-x-) compared with uninfected (-■-) while the α-hCG showed no significant difference when Chlamydia trachomatis infected trophoblast (-▲-) is compared with uninfected trophoblast (-♦-). All values represent means ± SEM (n = 3).


