
Figure 1. Model showing effect of stoichiometry of gene regulatory complexes and its consequences in generating phenotypes.
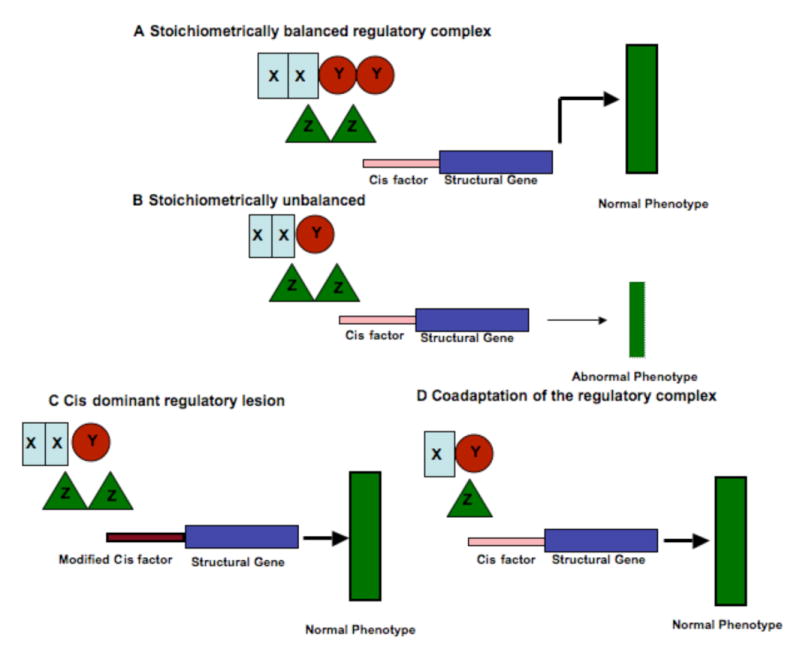
Panel A shows a stoichiometrically balanced regulatory complex depicted by sets of rectangles, circles and triangles (XX:YY:ZZ::1:1:1), which is able to properly communicate/interact with the cis factor of a target structural gene, which leads to a (normal) phenotype depicted by a thick green rectangle. In panel B the stoichiometry of the regulatory complex is altered and thus unbalanced (XX:Y:ZZ::2:1:2) so interaction with the cis elements of target loci is modified such that an abnormal phenotype (depicted by a thinner green rectangle) is produced. This phenotype might be selected against. Panel C shows modification in a cis factor (depicted by brown rectangle) such that a shift from the balanced regulatory complex (XX:YY:ZZ::1:1:1) to the unbalanced state (XX:Y:ZZ::2:1:2) is tolerated. Panel D depicts co-adaptation of the unbalanced regulatory complex over time to attain a new balance (X:Y:Z::1:1:1) leading to the normal phenotype.