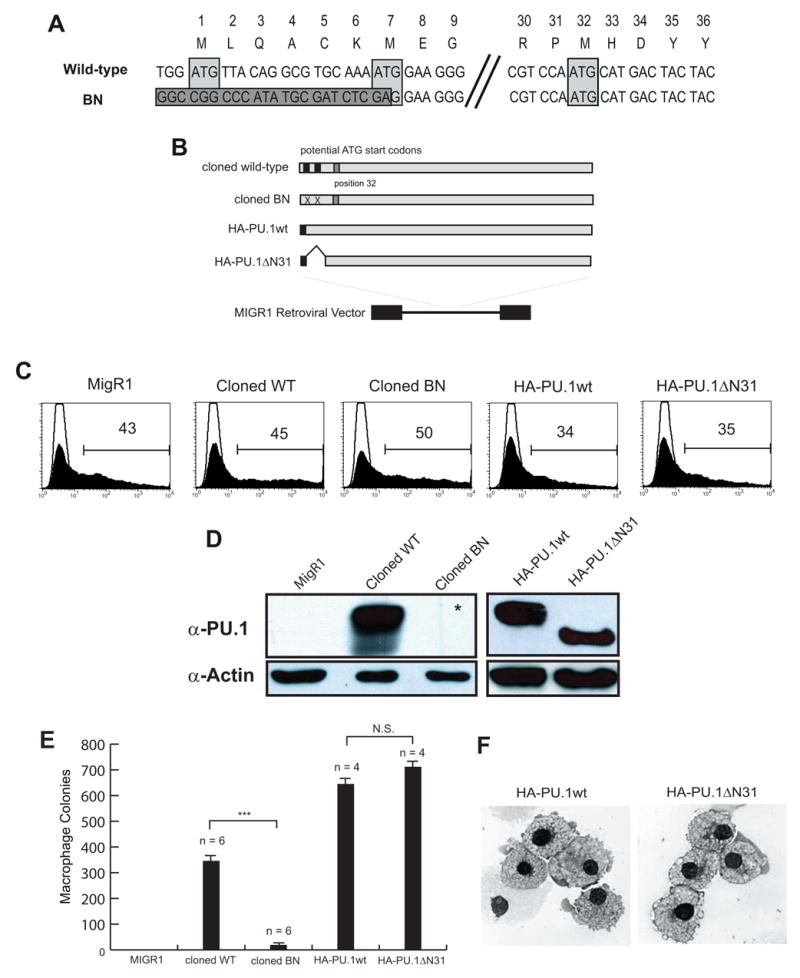
Figure 3. PU.1 activity is reduced by the BN mutation in both myeloid and lymphoid lineages.

(A) Alignment of genomic DNA sequences of wild-type and targeted Sfpi1BN/BN including previously identified codon locations and their equivalent amino acids. The dark gray box indicates sequence following genomic DNA targeting resulting in the removal of both previously identified ATG-start codons (light gray boxes). Position 32 contains an in-frame potential ATG-start codon (3rd light gray box). (B) Diagram of cloning strategy to generate retroviruses. (C) Flow cytometric analysis of transfected Plat-E cells measuring GFP expression and demonstrating equivalent transfection efficiency of the indicated retroviruses. (D) Western blot analysis of transfected cells analyzed in (B) showing reduced expression of PU.1 protein from the cloned BN retrovirus. The asterisk indicates that a band was seen upon longer exposure. (E) Colony forming ability of retrovirally-infected Sfpi1−/− fetal liver progenitors (FLPs). Sfpi1−/−FLPs were isolated according to Materials and Methods and spin-infected with the indicated retrovirus. Cells were plated in methylcellulose containing M-CSF and colonies were counted after 5 days. Numbers correspond to number of colonies per 105 infected cells plated (*** - p <= .001). (F) Cytospins of cells from methylcellulose plates from (E). Cytospun and Wright stained cells were visualized using an Olympus BH2 light microscope and photographed as described in Materials and Methods.
