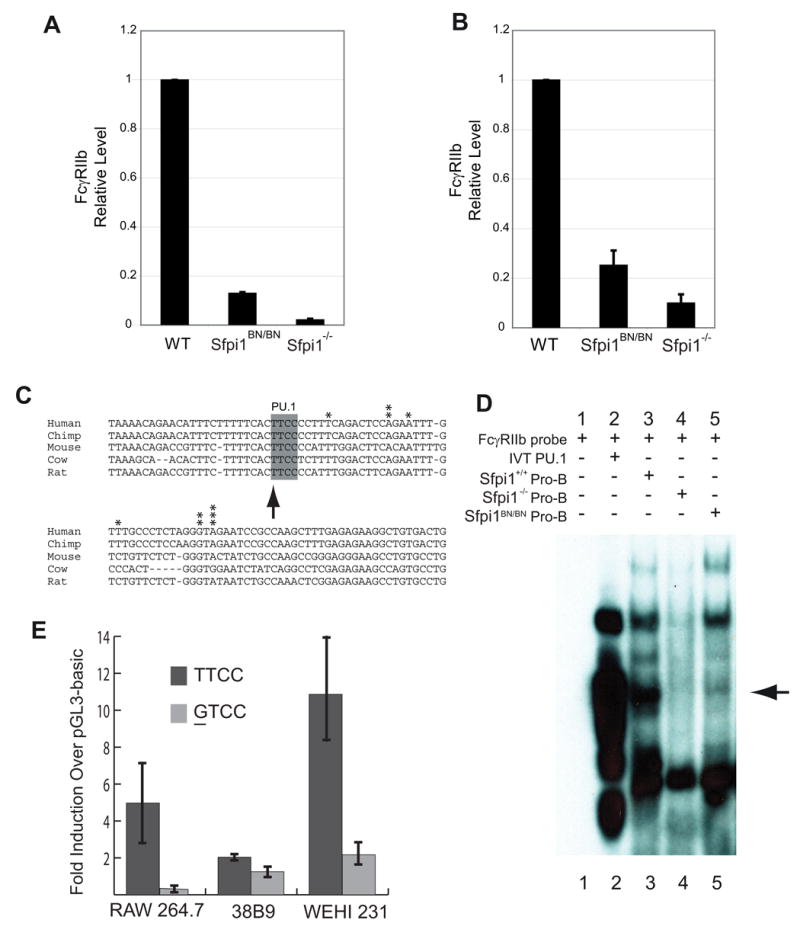
Figure 4. Reduction in PU.1 Activity as Measured by Transcription of the FcγRIIb gene.

(A) Real-time RT-PCR analysis of FcγRIIb expression from RNA prepared from cultured IL-3-dependent myeloid cells of the indicated genotype. (B) Real-time RT-PCR analysis of FcγRIIb expression from RNA samples obtained from cultured IL-7-dependent pro-B cells of the indicated genotype. (C) Sequence comparison of the FcγRIIb promoter among various species. Arrow indicates PU.1-binding site. Asterisks indicate identified transcription start sites. (D) Electrophoretic mobility shift assay of nuclear lysates using an FcγRIIb probe. Arrow indicates the band corresponding to PU.1 interacting with the DNA probe. (E) Luciferase reporter assays using wild-type (TTCC) or mutated (GTCC) PU.1 binding site indicated in (C). Cell lines used include RAW264.7 (macrophage), 38B9 (pro-B), WEHI-231 (B cells).
