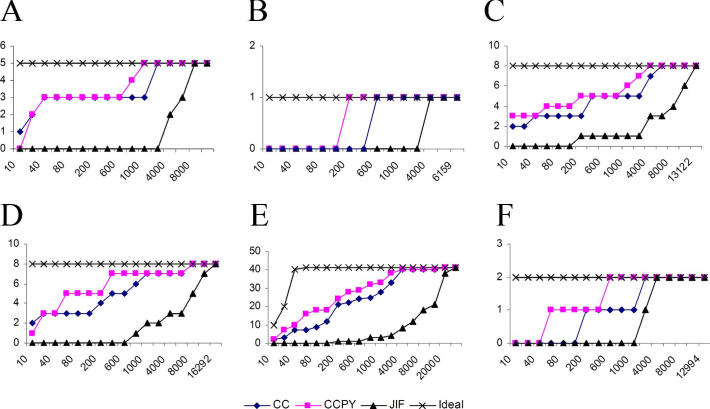
Figure 3.
The Hit curves of the six clusters (A, B, C, D, E and F) derived from “breast cancer” data set. The x-axis represents the number of ranked documents, while the y-axis represents the SSO_AB articles found in the top ranked document list. (e.g., in cluster E, using CCPY as the ranking function, among the top 40 ranked document list, 7 of the documents are important articles.) CC—Citation Count; CCPY—Citation Count Per Year; JIF—Journal Impact Factor. As a ranking function, CCPY outperforms CC and JIF. To provide an upper bound, we also plot the hit curve of an ideal ranking strategy, which ranks all the important articles at the top of the result list. Therefore, the ranking algorithm corresponding to the hit curve that is “closest” to the ideal hit curve is the best algorithm.

