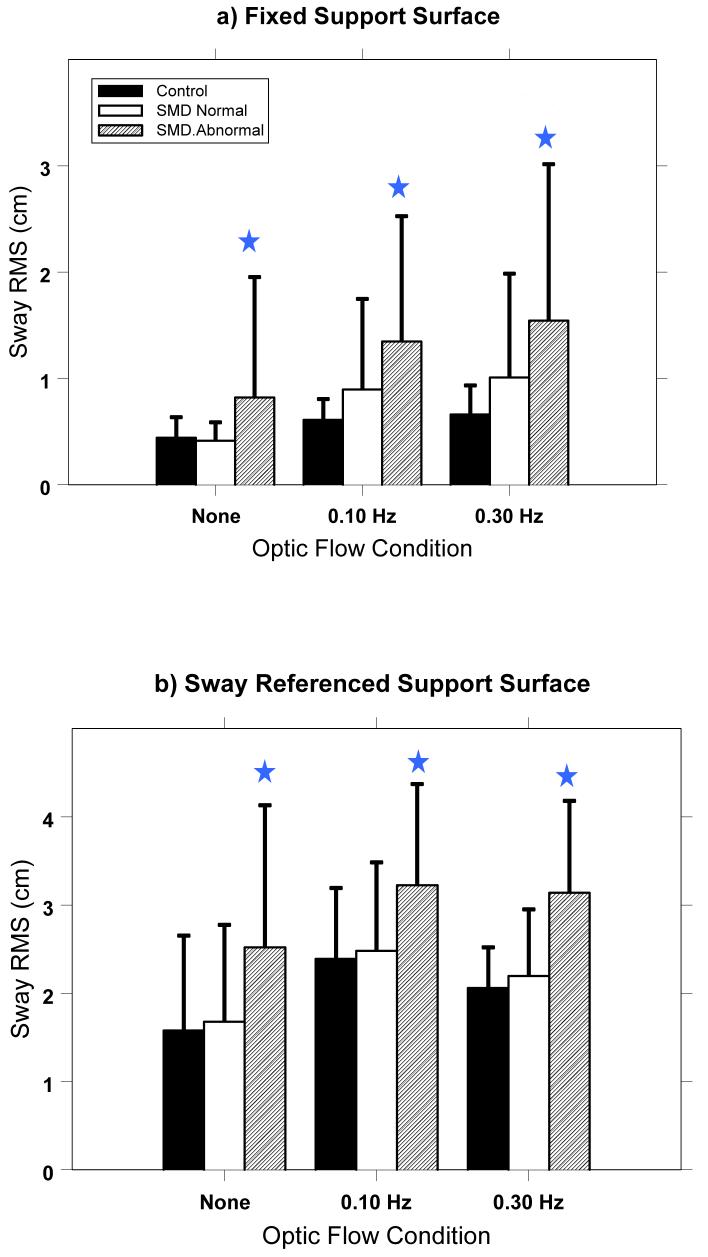
Figure 3.
RMS sway for the Control group, Patients with Normal SMD, and Patients with Abnormal SMD for each stimulus condition during a) fixed platform and b) sway referenced platform conditions. (Error bars are one standard deviation across subjects.) Stars represent a significant difference (p<.05) between the Abnormal SMD patient groups and Control group. Note that patients with Abnormal SMD sway more than Controls and more than patients with Normal SMD under all conditions.

