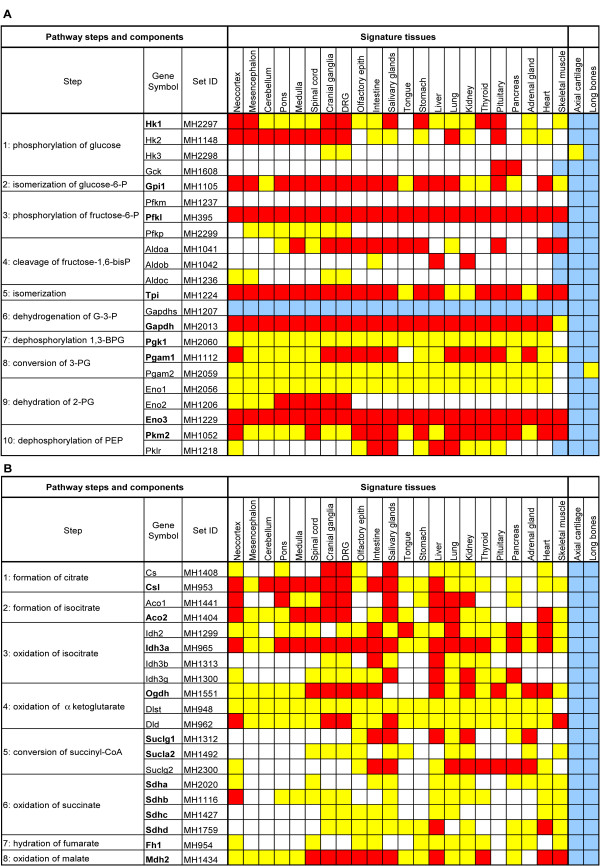
Figure 3.
Matrices representing the expression pattern of glycolysis (A) and TCA cycle (B) genes in signature tissues. The expression level for each gene is shown in color. Red signifies strong expression; yellow, medium; and blank, weak expression. In cases where transcripts could not be detected, boxes are shown in blue. The Genepaint set IDs point to the data sets from which quantitative assessments were made. Genes showing a SEMP are in bold.

