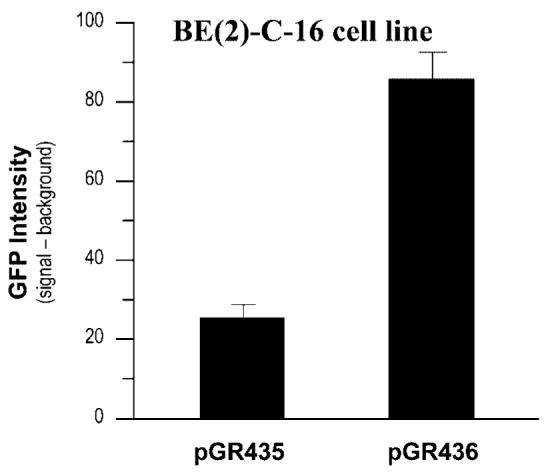
Fig. 2.

This graph shows the increase in GFP expression levels driven by the 6.3 kb human TH minimal promoter in the presence of the 1.2 kb first intron fragment of the human TH gene (plasmid pGR436) following transfection into human neuroblastoma BE(2)-C-16 cell line. Plasmid pGR435 contains only the 6.3 kb human TH minimal promoter. GFP expression and background were quantified in Photoshop. Each difference (GFP signal–background) represents the mean value +/− standard deviation of three determinants.
