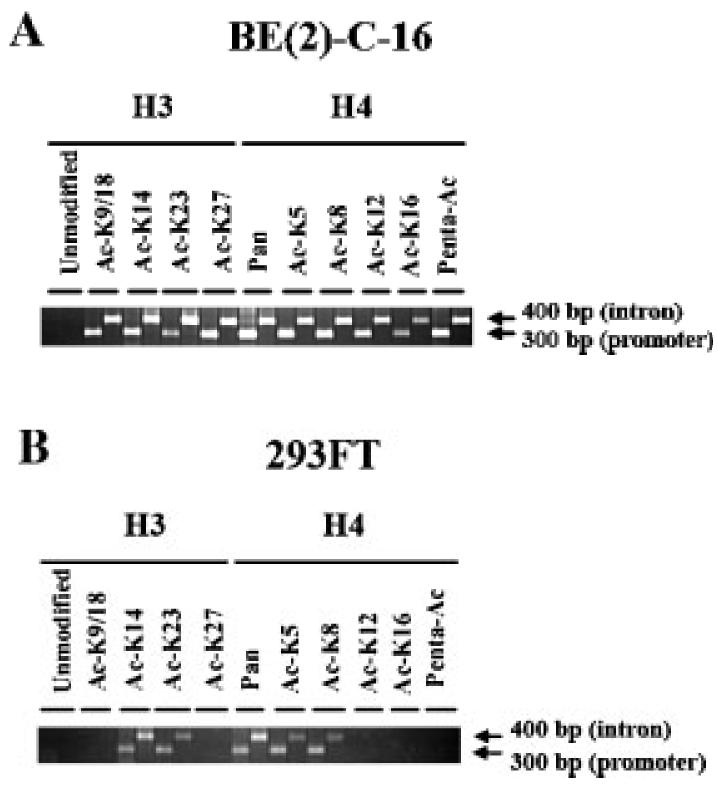
Fig. 5.

Chip analysis of H3 and H4 tail acetylation in human neuroblastoma BE(2)-C-16 cell line (part A) and human renal carcinoma 293FT cell line (part B). PCR analysis on Chip products was conducted per each antibody with two sets of primers annealing to regions (−87/+196) and (+106/+542) of the promoter, first exon and first intron of the human TH gene in both cell types. Two arrows depict 300 and 400 bp PCR products in parts A and B (right hand-side), which correspond to the PCR signals associated with region (−87/+196) and (+106/+542), respectively. The part of antibodies used for Chip analysis is divided into two groups: H3 and H4 (parts A and B). The specificity of each antibody is reported either below the annotation H3 or H4. The antibody to unmodified H3 is the only one that tested negative for both cell lines. Two primers were used to amplify a 283 bp sequence of the endogenous estrogen receptor-alpha as positive control for the antibody to unmodified H3 (Macaluso et al., 2003, 2006) (data not shown).
