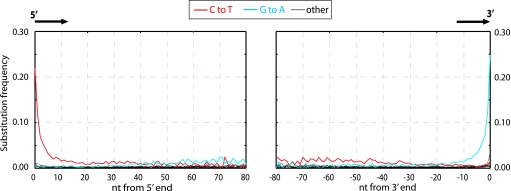
Fig. 3.
Misincorporation patterns in Neandertal DNA sequences. The frequencies of the 12 possible mismatches are plotted as a function of distance from 5′- and 3′-ends. At each position, the substitution frequency, e.g., C-T, is calculated as the proportion of human reference sequence positions carrying C where the 454 sequence is T. The 10 5′- and 10 3′-most nucleotides were removed from the 3′- and 5′-graphs, respectively.

