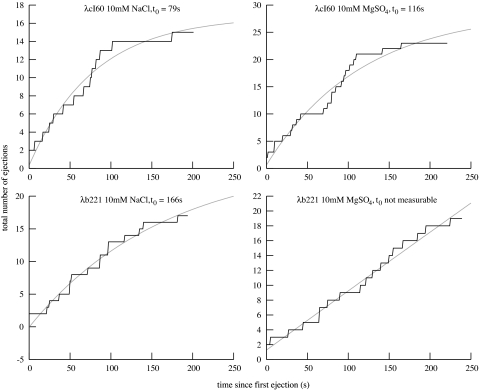
Fig. 4.
The number of ejections that have been triggered as a function of time. For each experiment, the total number of ejections that had been observed was plotted as a function of time; these are the same ejections that were used for the analysis above. Also plotted are exponential least-squares fits of the form a(1 − exp(−t/t0)) + b, where t0 is the time constant of triggering. To take into account the delay before LamB entered the flow chamber, we set t = 0 at the time of the first observed ejection.

