Fig. 4.
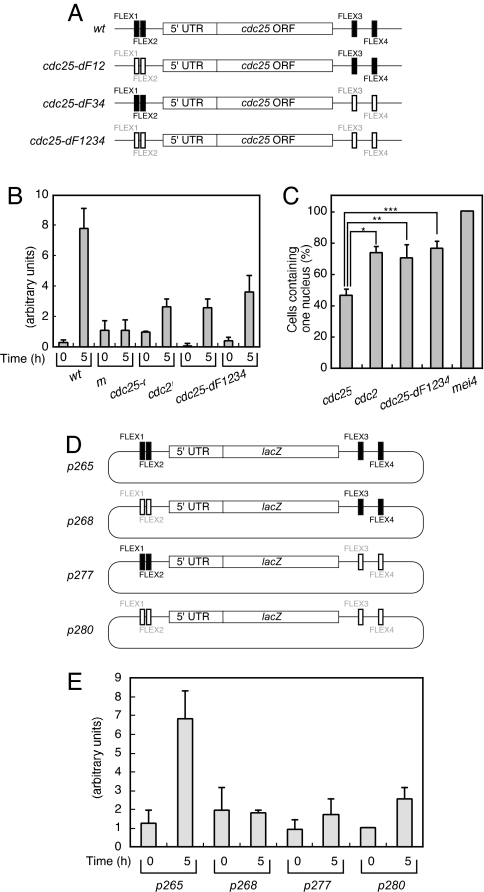
Effects of the FLEX sites of cdc25+ on gene expression and cell cycle progression. (A) Mutation of the FLEX sequences associated with cdc25+. Shaded and open boxes represent intact and deleted FLEX elements, respectively. (B) Cells of the indicated genotypes (WT, HM1307; mei4, HM2163; cdc25-dF12, HM5969; cdc25-dF34, HM5970; and cdc25-dF1234, HM5973) were subjected to induction of meiosis as described in Fig. 1. Samples were collected at the indicated times thereafter for determination of the amount of cdc25+ mRNA by quantitative RT-PCR analysis. Data are means ± SE from at least three independent experiments. (C) Cells treated as in B were analyzed for the proportion containing one nucleus 5 h after the temperature shift. Data are means ± SE from at least three independent experiments. *, P < 0.001; **, P < 0.007; ***, P < 0.001 for the indicated comparisons. (D) Schematic representation of plasmids containing lacZ+ surrounded by genomic DNA fragments corresponding to the upstream and downstream regions of cdc25+. Shaded and open boxes represent intact and deleted FLEX elements, respectively. (E) The various plasmids shown in D were introduced into WT cells (HM5630), which were subsequently induced to undergo meiosis as described in Fig. 1. The amount of lacZ+ mRNA was measured by quantitative RT-PCR at the indicated times thereafter. Data are means ± SE from at least three independent experiments.

