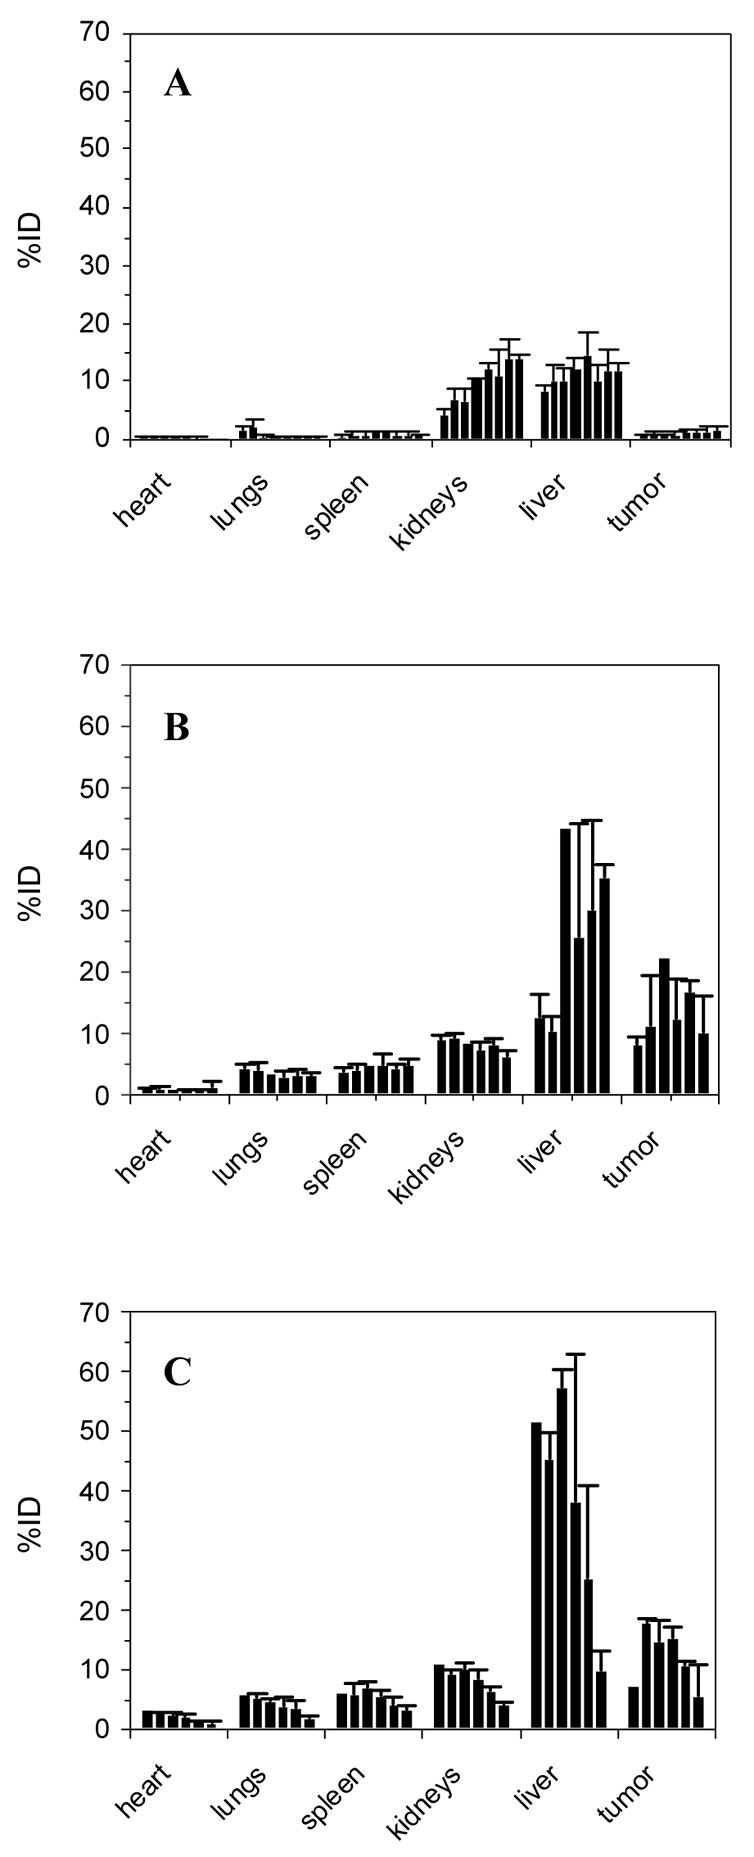
Figure 2.

Time-dependent organ uptake of [3H]-CpG-ODN (A), DNP-[3H]-CpG-ODN (B), and DNP2-[3H]-CpG-ODN (C) in CT26 tumor-bearing mice. In the case of DNP- and DNP2-[3H]-CpG-ODN, mice were immunized against DNP prior to tumor development. Data at each timepoint are shown as the average percent injected dose (%ID) ± SEM, n= 3. Timepoints are graphed sequentially from left to right in the following order: 1, 2.5, 5, 10, 20, 35, 60, 120 min (A) and 0.5, 2, 12, 24, 48, 72 hours (B) and (C).
