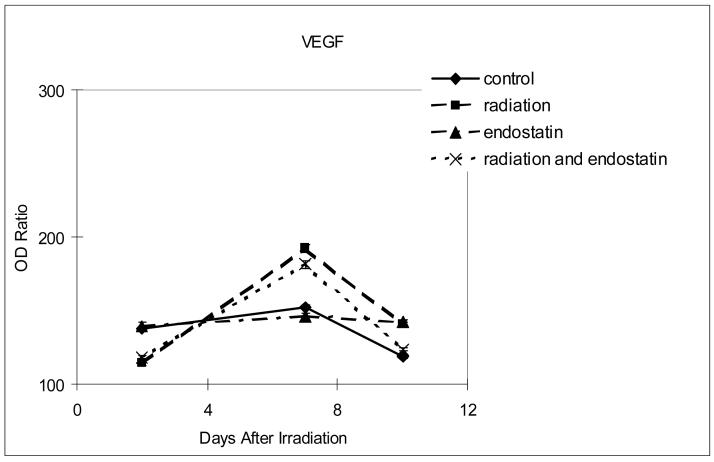
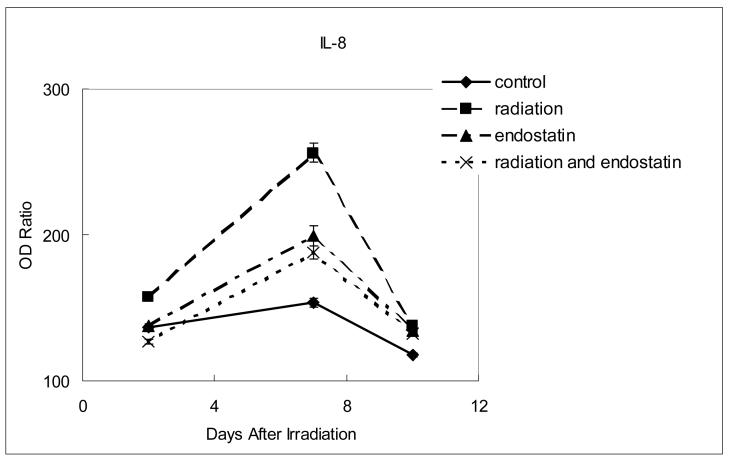
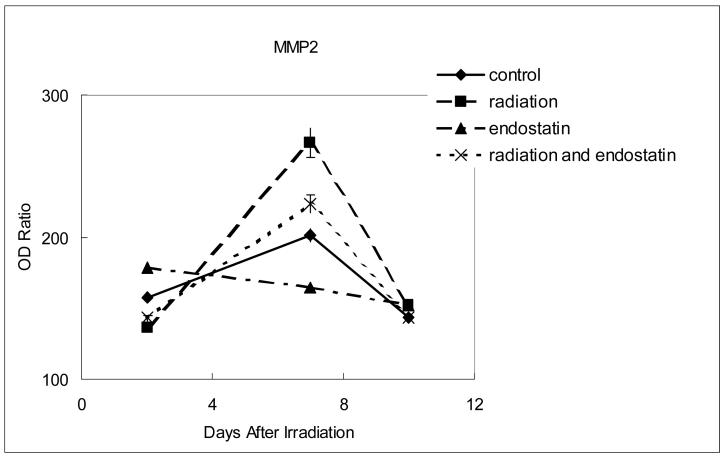
Figure 6.
Time course analyses of the expression of proangiogenic and invasive molecules. The expression of VEGF, IL-8, or MMP-2 was determined by the absorbance intensity for each of the differently treated tumor tissues was measured in 10 random fields at ×200 magnification using Optimas Image Analysis software (Bioscan). The cytoplasmic immunoreactivity was evaluated by computer-assisted image analysis and was expressed as a ratio of tumor cell expression to normal muscle cell expression multiplied by 100. (a) Expression of VEGF. (b) Expression of IL-8. (c) Expression of MMP-2.


