
Figure 5.
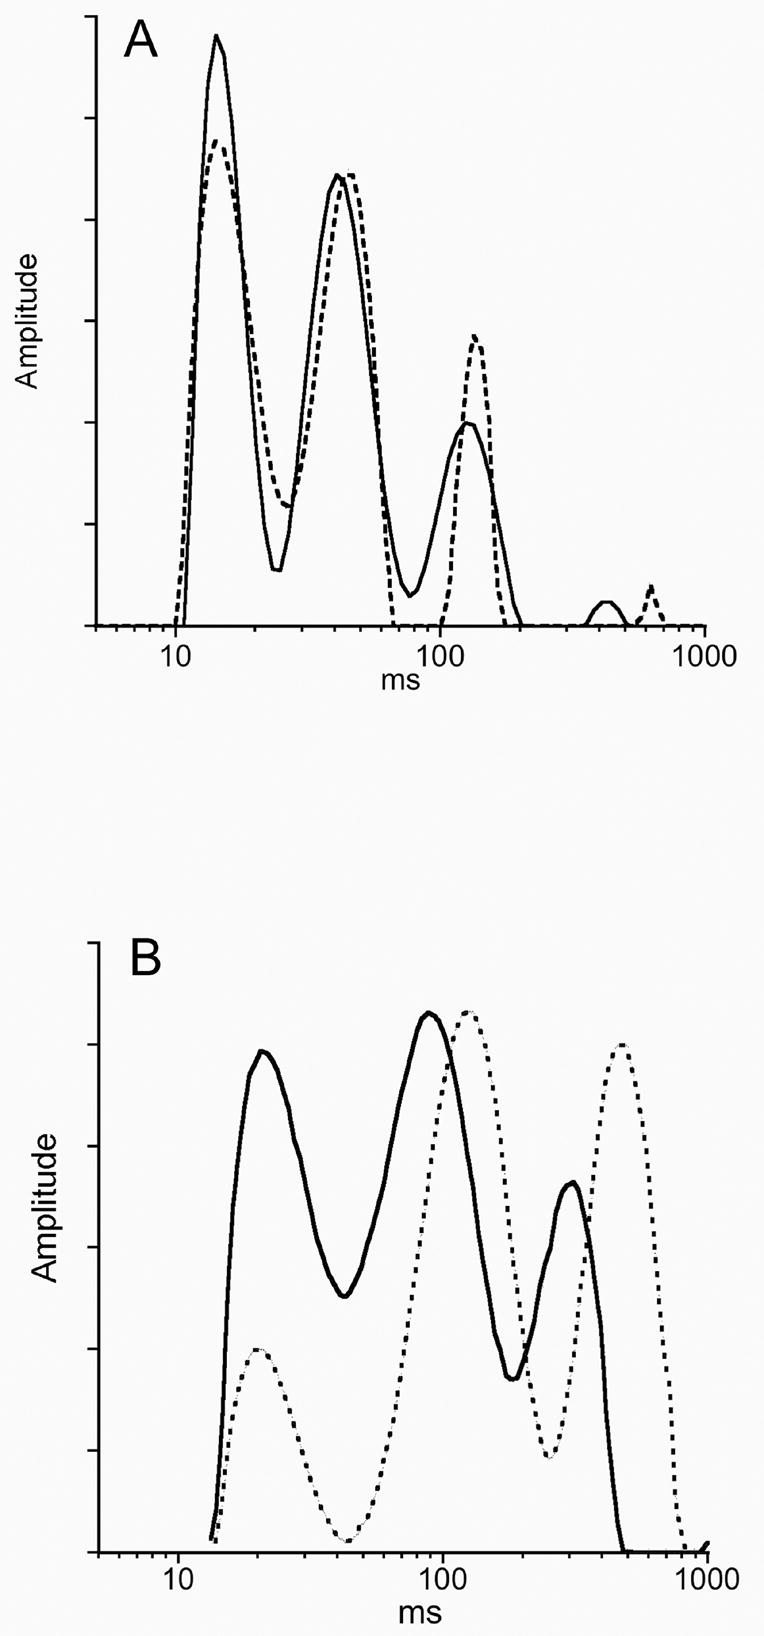
Representative spectra of sciatic nerve water T2 relaxation times. The three nerve-water components are shown as peaks from left to right: myelin, axonal and extra-axonal water. (A) The spectra from a Control 13 ppm Cu rat (solid line) and a DEDC 13 ppm Cu animal (dotted line) showing a relative decrease in the area of the first component of the DEDC exposed nerve. (B) The spectra obtained from a Control 200 ppm Cu nerve (solid line) and a PDTC 200 ppm Cu nerve (dotted line) showing a relatively greater decrease in the area of the first component and an increase in the area of the third component for the PDTC exposed nerve. Additionally, the three components for the PDTC and 200 ppm Cu Control nerves are shifted to longer T2 times relative to those in (A).