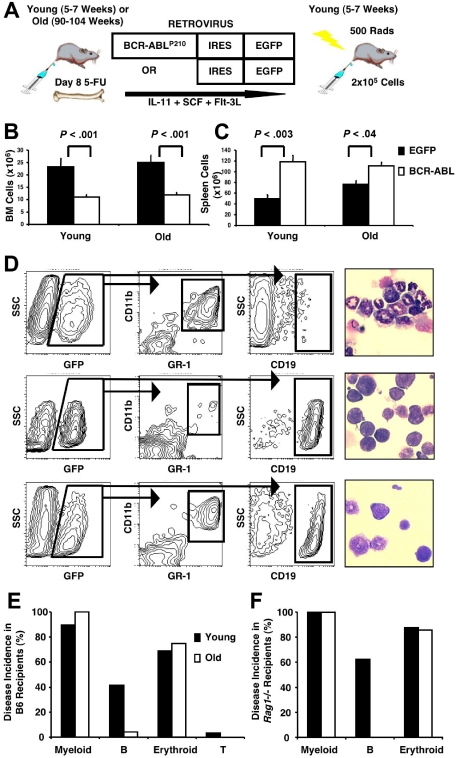
Figure 1.
Age alters the phenotype of BCR-ABLP210–induced leukemia. (A) BM from young or old B6 mice was harvested on day 8 after 5-FU treatment, infected with a retrovirus carrying a bicistronic IRES expression vector encoding BCR-ABLP210 and a reporter EGFP gene, and transplanted into sublethally irradiated, young syngeneic or congenic recipients. Control recipients received BM transduced with EGFP alone. Leukemias were accompanied by decreased BM (B) and increased splenic (C) cellularity. Cell numbers represent mean values plus or minus SEM obtained from 5 independent experiments with 29 recipients of young BMBCR-ABL, 24 recipients of old BMBCR-ABL, 9 recipients of young BMEGFP, and 5 recipients of old BMEGFP. (D) Leukemic cells in the BM were characterized by flow cytometry for expression of GFP (BCR-ABLP210) in combination with lineage-specific cell-surface antigens. Examples of recipients with an MPD (top panels), B-lymphoid leukemia (middle panels), and both an MPD and lymphoid leukemia (bottom panels) are shown. Recipients that developed an MPD had increased granulocytes and decreased lymphocytes in the spleen (top right panel), whereas the ones that developed B-lymphoid leukemia had increased lymphoid cells and blasts in the spleen (middle right panel) compared with controls (× 400 magnification). Images were viewed with a Leitz Laborlux D microscope (Leitz, Wetzlar, Germany) using a 40×/0.70 NA phase-contrast objective. Cells were deposited onto slides with a cytocentrifuge (Shandon-Elliot, Sewickley, PA) and stained with Wright-Giemsa. Coverslips were mounted with Permount (Biomeda, Foster City, CA). Micrographs were taken using an Olympus DP11 camera (Olympus, Tokyo, Japan), and prepared using Adobe Photoshop image-acquisition software (Adobe Systems, San Jose, CA). (E,F) Summary of the incidence of leukemia according to phenotype in B6 (E) and Rag1−/− (F) recipients of young and old BMBCR-ABL cells. The data shown in panel E are based on the same recipients as those shown in panels B and C, and data shown in panel F are based on 8 recipients of young and 7 recipients of old BMBCR-ABL cells.

