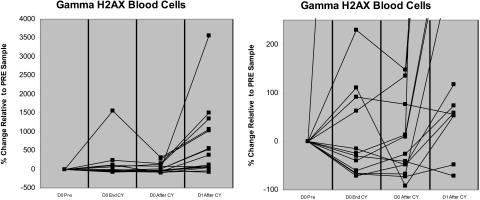
Figure 1.
Changes in γH2AX induced by CY and clofarabine-CY. (A) Increase in H2AX phosphorylation in circulating leukemia cells from peripheral blood. The peripheral blood blasts were obtained from 13 patients and the presence and magnitude of DNA damage was measured by flow-cytometric analysis prior to initial CY (D0 pre), at the end of CY infusion (D0 End CY), 2 hours after EOI of day 0 CY (D0 After CY), and on day 1 following clofarabine-CY (2 hours after CY; D1 After CY). Cellular debris was gated out and nonspecific staining controls were used to mark the lower limit of the positive γH2AX-staining region (SR). Control SR was subtracted from SR of samples to determine the percentage of cells staining positive for γH2AX (expressed as % γH2AX). Pretreatment value was expressed as zero and all other values were percentage change. An expanded y-axis (−100% to 250%) is presented in panel B to highlight the differences in γH2AX at the measured time points.

