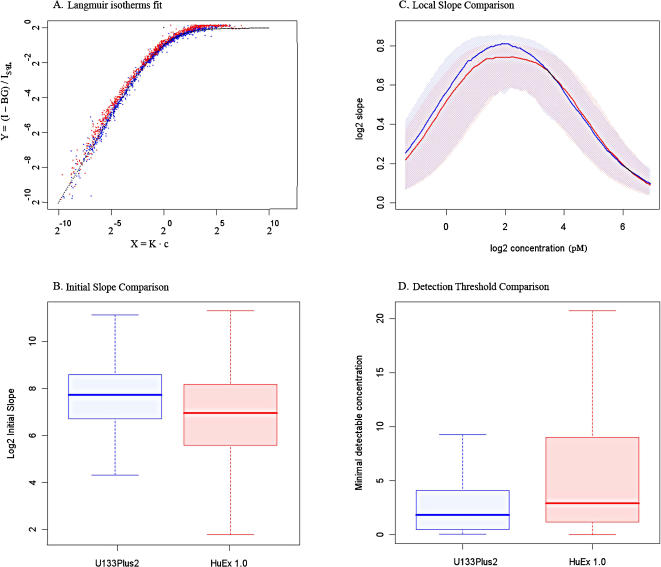
Figure 2. A) Model fit for HuEx [red] and U133Plus2 [blue].
After each probe has been fit to the model, described in Material and Methods, the rescaled variables  overlay the classical Langmuir adsorption isotherm, shown in dotted black. B) Distribution of Initial Slopes for HuEx [red boxplot] and U133Plus2 [blue boxplot] spiked probes. C) Local slopes as a function of concentration for HuEx [median red line and inter-quartile range shaded red] vs U133Plus2 [median blue line and inter-quartile range shaded blue]. Local slopes represent the fitted log2 fold-change for probes with true log2 fold-change of 1 as a function of the nominal concentration. D) Distribution of detection threshold for HuEx 1.0 [red boxplot] and U133Plus2 [blue boxplot] spiked probes. Detection threshold is referred to probe concentration where signal-to-noise ratio exceeds 3.

