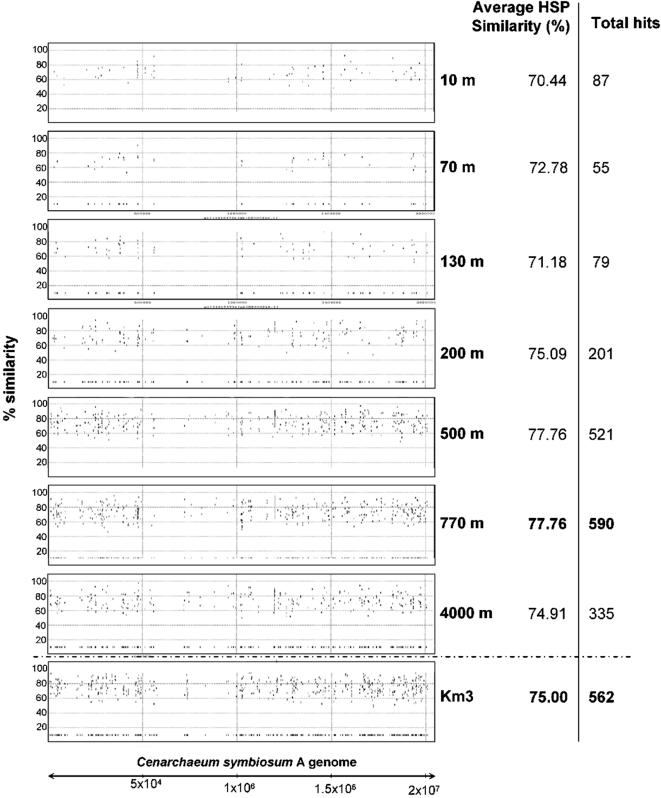
Figure 4. Genome recruitment by Cenarchaeum symbiosum A.
Individual fosmid-end sequences were aligned to the sequenced strain genome and the alignment-sequence conservation visualized in the form of percent identity plot. Each dot of the graph represents an individual fosmid-end sequence aligned along its homologous region in C. symbiosum A genome. Y axis reflects its nucleotide percent identity to the syntenic region. Both Km3 and ALOHA water column datasets were used.

