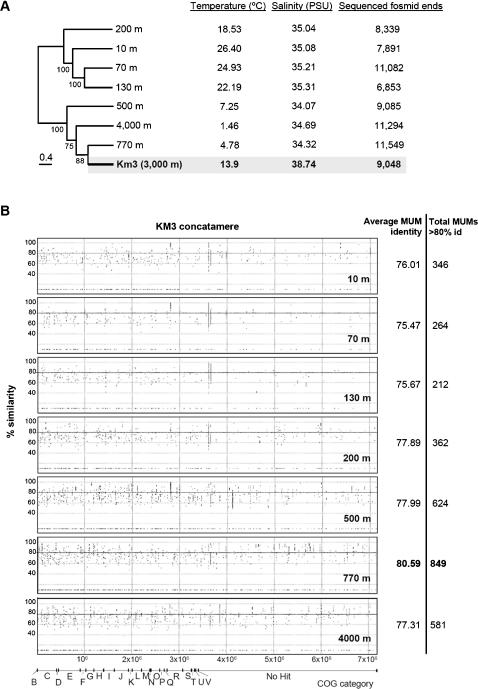
Figure 7. Normalized metagenome comparison of 3000 m-deep Mediterranean Km3 and Pacific ALOHA water column.
For normalization, a total of 6,853 sequences (size of the smallest library compared, ALOHA 130 m) from each library were randomly selected and compared. A, Neighbour joining analysis of fosmid-end sequences in Km3 and different depths in ALOHA. Temperature, salinity, and the total number of sequences available for each library are shown on the right; Jackknife values, at nodes. B, Normalized MUMmer plots showing the number of maximal unique matches (MUMs) shared by the 3000 m deep Km3 and the different ALOHA metagenomic libraries. MUMs are distributed as a function of their identity (ordinates) and the type of COG to which they belong (abscises). Average identity values are indicated for each pair of libraries compared. The number of MUMs having more that 80% identity are given to the right of each panel.

