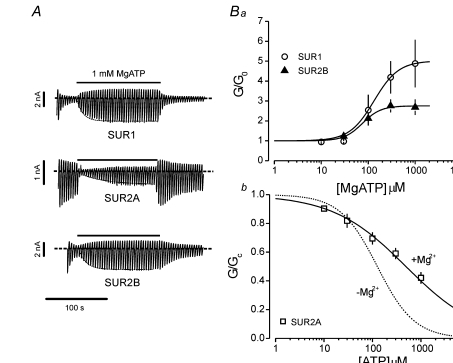
Figure 3.
ATP sensitivity in the presence of Mg2+ A, Kir6.2-F333I/SUR1, Kir6.2-F333I/SUR2A and Kir6.2-F333I/SUR2B currents elicited by voltage ramps from −110 to +100 mV. The dotted lines are single exponential fits to the current activation, with time constants of 20 s (SUR1), 49 s (SUR2A) and 28 s (SUR2B). The dashed lines indicate the zero current level. B, mean relationship between [MgATP] and KATP conductance (G), expressed relative to the conductance in the absence of nucleotide (G0) for Kir6.2-F333I plus (a) SUR1 (○), SUR2B (▴) and (b) SUR2A (□). Ba, the lines are the best fit of eqn (2) (EC50 = 115 μm, A = 4.6 for SUR1; EC50 = 53 μm, A = 2.2 for SUR2B). Bb, the smooth line is the best fit of eqn (1) (IC50 = 548 μm). The dotted line is the fit to the data in the absence of Mg2+ in Fig. 1B.

