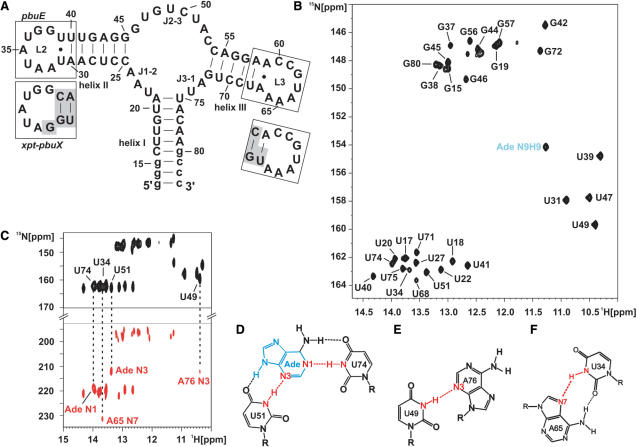
Figure 1.
Adenine binding the adenine-sensing riboswitch and complete imino resonance assignment. (A) Secondary structure of the aptamer domain of the pbuE adenine-sensing riboswitch from B. subtilis where loops L2 and L3 are boxed. The sequence of L2 and L3 of the xpt–pbuX guanine-sensing riboswitch from B. subtilis is shown below in separate boxes. Nucleotides that are different in the guanine-sensing riboswitch compared to the adenine-sensing riboswitch are shaded in gray. (B) Imino region of a 1H,15N-HSQC spectrum of the aptamer domain of the adenine-sensing riboswitch RNA in complex with adenine and complete imino resonance assignment in the absence of Mg2+ at 10°C. The signal of the H9N9 imino group of adenine is labeled in blue. (C) HNN-COSY experiment of the RNA–adenine complex in the absence of Mg2+ at 10°C. The correlation from the hydrogen bond donor (N-H, black resonances) to the hydrogen bond acceptor (N, red resonances) is indicated by dashed lines for RNA–adenine intermolecular hydrogen bonds and for selected tertiary interactions. Schematic drawing of the intermolecular base triple (D) involving adenine recognition by U74 and U51 from the adenine-sensing riboswitch, (E) the interaction between U49 and A76, and (F) the long-range reversed-Hoogsteen A65:U34 base pair. All hydrogen bonds are indicated by dashed lines. Hydrogen bonds including the hydrogen bond donor and the hydrogen bond acceptor which are detected and annotated in (C) are shown in red. The adenine ligand is shown in blue.

