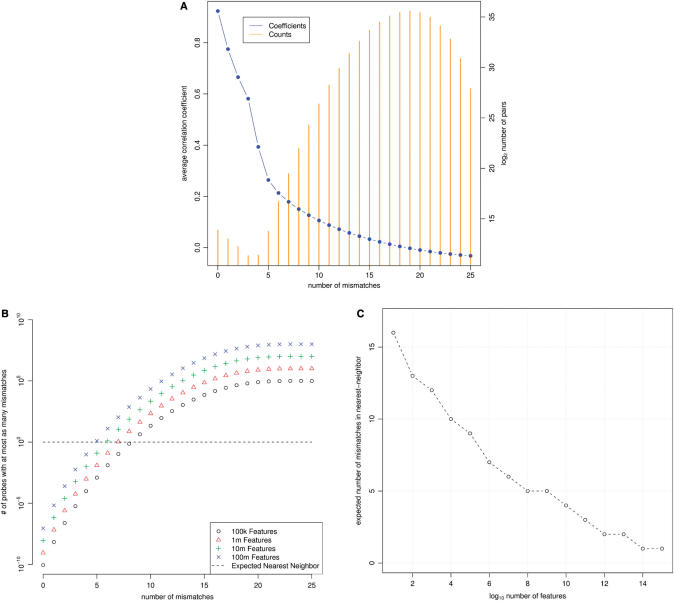
Figure 2.
Properties of the nearest-neighbor strategy. (A) Feature pairs with several mismatches are weak predictors of signal. All possible pairs of features from a single tiling microarray design were analyzed. The average correlation coefficients (blue circles, left axis) and number of pairs contributing to those averages (orange bars, right axis) are plotted for all possible number of mismatches. (B) Expected number of mismatches between a tile and its nearest-neighbor probe sequence. For a number of mismatches, k, the expected number of features having k or fewer mismatches to any 25nt tile is plotted. These expectations are plotted for array designs having 105, 106, 107 and 108 features. The value of k for which a series crosses unity on the y-axis represents the expected number of mismatches between a tile and its nearest-neighbor probe sequence. (C) Detail of this cross-section.

