Figure 1.
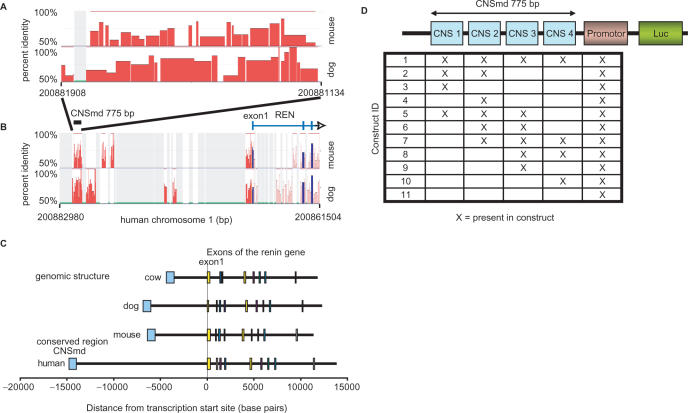
(A, B) Percent identity plots (PIP). Each plot shows the position in the human sequence (horizontal axis) and the percent identity (vertical axis) of each aligning sequence of mouse and dog. This plot was used to identify the CNSmd region containing conserved sequences ∼14 kb upstream of REN. (B) shows the region of interest in a 21 kb window and (A) is a zoomed region containing the CNSmd. The plots are modified versions of plots generated using the PIPtool at www.dcode.org. The blue bars correspond to coding, the red bars to non-coding regions. (C) Genomic structure of the renin gene of four species. The conserved regions show different distances to the transcription start site in the four species. (D) Schematic description of vectors used in reporter gene assays. The CNSmd region was divided into four approximately equally sized overlapping parts CNS1 to CNS4. These four parts were tested in 11 different combinatorial constructs with respect to their action on promoter activity in luciferase assay. All possible 11 combinations with natural neighbouring relationships in CNSmd were cloned out of the 15 total possible combinations.

