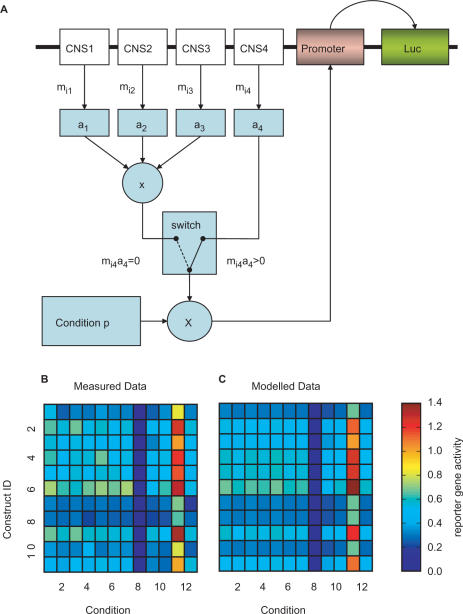
Figure 3.
(A) Graphical representation of the selected switch model. The sum of the scaled influence of each CNS region is scaled by a condition-specific impact on the promoter. If CNS4 is present its influence becomes dominant. Gene activity from the experiments in comparison with the prediction of the switch model. (B) The reporter gene activity is shown for the 11 constructs and the 12 different cellular conditions. (C) The models prediction after fitting the switch model to the experimental data. The prediction fits well the data obtained in the experiments. The Pearson correlation coefficient between data and model prediction is 0.968.

