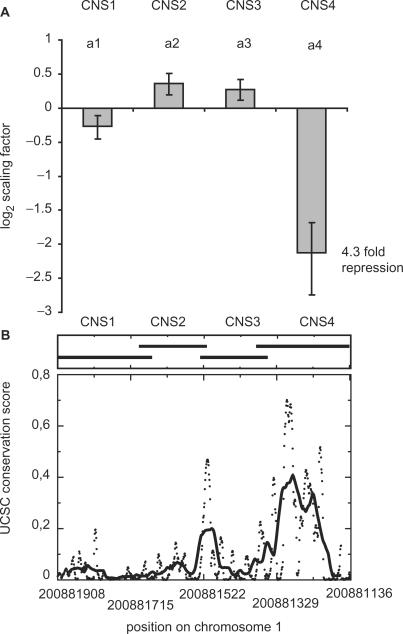
Figure 4.
(A) Impact of the CNS regions on reporter gene activity. CNS4 shows the largest impact and this corresponds with a high conservation score. (B) The UCSC conservation score for the corresponding regions on the human chromosome 1. The conservation score was obtained from UCSC and refers to a joined comparison with seven other vertebrates. The dots represent the score and the bold line the moving average of the score.

