Figure 2.
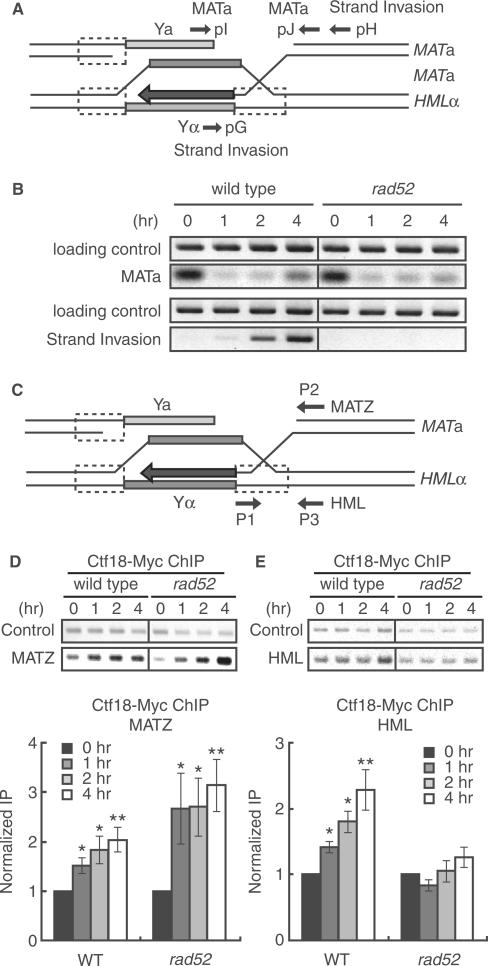
Ctf18 associated with HR intermediate. DSBs were induced in JKM161 cells that express Ctf18-13Myc and carry the HML donor sequence by treating cells with 2% galactose for 1 h, which induces the expression of the HO endonuclease, The cells were subsequently incubated in 2% glucose to repress the expression of the HO endonuclease. Genomic DNA was isolated at the indicated time points after the addition of galactose. (A) A schematic representation of the HR intermediates formed during mating-type switching. The approximate location of the primers used to monitor DSBs (pI and pJ primers) and strand invasion (pG and pH primers) are shown. (B) Time course of the formation of DSBs and the formation of strand-invasion intermediates following induction of HO-endonuclease expression. DNA was purified from cells at the indicated time points after transient expression of HO endonuclease. PCR was carried out using primers that flanked the MATa locus: pI and pJ primers were used to detect the formation of the DSB (upper panel) or pG and pH primers were used to detect products of strand invasion and primer extension (lower panel). The SMC2 locus was amplified as a loading control. The data are representative of three independent experiments. (C) A schematic representation of the MATa and HML loci showing the location of the primers used to detect an association of Ctf18 with sequences at the DSB site (P1 and P2 primers for the CEN-distal MATZ locus) or the homologous donor region (P1 and P3 primers for the HML locus) and (D and E) Wild type (YHO411) and rad52 mutant (YHO412) cells expressing Ctf18-13Myc were treated as described for B, and chromatin from the cells at the indicated time points after addition of galactose was subjected to immunoprecipitation using anti-Myc antibodies. DNA present in anti-Myc immune complexes was analyzed by PCR using primers specific for sequences at the DSB site (P1 and P2 primers for the CEN-distal MATZ locus; D) or the homologous donor region (P1 and P3 primers for the HML locus; E), as indicated. Representative images of agarose gels are shown (upper panels). Data from each target locus was normalized to the control SMC2 product. Fold increase was calculated by normalizing the data from each time point to the zero time point value (Bottom panel). The columns and error bars represent the means and SDs (n = 4). The asterisks indicate statistical significances of the results compared to that of 0 h evaluated by Student's t-test (*; P < 0.05; **; P < 0.005).

