Abstract
Electrospray ionization with Fourier-transform ion cyclotron resonance mass spectrometry (ESI–FT ICR MS) is a powerful tool for analyzing the precise structural features of biopolymers, including oligonucleotides. Here, we described the detailed characterization of a newly discovered nuclease activity of the C-terminal domain of Thermus thermophilus MutS2 (ttMutS2). Using this method, the length, nucleotide content and nature of the 5′- and 3′-termini of the product oligonucleotides were accurately identified. It is revealed that the C-terminal domain of ttMutS2 incised the phosphate backbone of oligodeoxynucleotides non-sequence-specifically at the 3′ side of the phosphates. The simultaneous identification of the innumerable fragments was achieved by the extremely high-accuracy of ESI–FT ICR MS.
INTRODUCTION
Nucleases play critical roles in DNA transactions including DNA replication, repair and recombination events (1–4). Detailed analysis of the enzymatic properties of a newly discovered nuclease activity is required in order to help identify cellular function. Nuclease digestion patterns are generally studied using radiolabeled oligonucleotides as substrate followed by electrophoretic analysis of the reaction mixture. However, this method only detects fragments containing the radiolabel. Multiple labeling of the substrate DNA is required in order to ascertain the location of all the cleaved sites. Furthermore, electrophoresis does not reveal the precise nature of the 5′ and 3′-termini at the cleaved site. Alternatively, mass spectrometry can detect all fragments produced by the nuclease without the need for using radioisotopes. Electrospray ionization (ESI) is a soft ionization technique which is suitable for large biopolymers, such as oligonucleotides, because the multiply charged ions lower the m/z (5–8). In addition, Fourier-transform ion cyclotron resonance mass spectrometry (FT ICR MS) is expected to achieve especially high mass accuracy in the analysis of mixtures of biopolymers and determination of the nature. In this study, we analyzed the degradation pattern of double-stranded DNA (dsDNA) by the catalytic domain of Thermus thermophilus MutS2 (ttMutS2) using ESI–FT ICR MS. To the best of our knowledge, this is the first report that a nuclease activity was characterized by ESI–FT ICR MS.
Bacterial MutS2 possesses domains homologous to the MutS family proteins (9–11) which are involved in DNA mismatch repair, DNA recombination and other DNA modifications. Recent studies showed that bacterial MutS2 is involved in suppression of homologous recombination (12–14) or/and protection from oxidative DNA damage (15). We previously revealed that ttMutS2 contains a nuclease activity (16,17), and the activity is confined to the C-terminal domain whose sequence is not conserved in the other MutS homologs. The amino acid sequences homologous to the C-terminal domain of bacterial MutS2 distribute in variety of proteins other than MutS homolog (18,19). It is also reported that the C-terminal domain of human BCL-3-binding protein shows sequence similarity to that of bacterial MutS2 and possesses a nuclease activity (20), although there is no relationship between the biological function of human BCL-3-binding protein and that of bacterial MutS2. The precise characteristics of their activities had been unknown.
MATERIALS AND METHODS
Oligonucleotides
The 5′-hydroxylated 3, 7, 15, 21 and 37-mer single-stranded oligodeoxynucleotides were synthesized. Their sequences are: 5′-GCT-3′, 5′-GCTCGTA-3′, 5′-GCTCGTAGAGTGGTC-3′, 5′-CGGTATCTTGGCTATGACGGC-3′, 5′-GCTCGTAGAGCGGTCATAGTCAAGATACCG-3′ and 5′-ATGTGAATCAGTATGGTTACTATCTGCTGAAGGAAAT-3′, respectively. They were purified after synthesis by high-performance liquid chromatography (HPLC) and their concentrations were determined from their absorbance at 260 nm. The 5′-phosphorylated or 5′-hydroxylated single-stranded oligodeoxynucleotides, 5′-ATGTGACTCAGTATGGG-3′, were also synthesized and purified by HPLC. Then, they were annealed to their complementary 5′- phosphorylated or 5′-hydroxylated single-stranded oligodeoxynucleotides (5′-CCCATACTGAGTCACAT-3′) to obtain double-stranded oligodeoxynucleotides in TE buffer. Annealing was performed in a thermal cycler according to the following temperature profile: 5 min at 95°C, followed by a slow decrease from 95°C to 37°C over 60 min and from 37 to 4°C over 30 min. Oligonucleotide which contains the locked nucleic acid (LNA) at 3′-terminal end was also synthesized.
Nuclease reaction
The C-terminal domain of ttMutS2 (CTD) was overexpressed and purified as described previously (17). The substrate oligonucleoitdes (25 μM) were incubated with 0, 50, 100 or 200 nM CTD in a buffer containing 50 mM Tris–HCl (pH 7.5), 100 mM KCl and 5 mM MgCl2 at 37°C for 16 h. The total volume of reaction mixture was 30 μl. Reactions were quenched by addition of an equal volume of phenol–chloroform solution and the mixtures were then centrifuged at 15 000 r.p.m for 10 min. Supernatants were loaded onto 5 μl of SuperQ resin equilibrated with water in a 0.6 ml Eppendorf tube. After washing with 30 μl of water three times, DNAs were eluted with 30 μl of 0.75 M ammonium acetate (pH 7). The elutants were dried in a centrifugal evaporator.
ESI–FT ICR MS analysis
The elutants were resuspended to a concentration of 1 μM in 50% methanol containing 25 mM imidazole and 25 mM piperidine. The 10 μl aliquots were loaded into quartz nanospray emitters. All measurements were performed on an Apex IV Fourier transform mass spectrometer (Bruker Daltonics, Billerica, MA, USA) equipped with a 9.4-T shielded superconductive magnet. The oligonucleotide solutions were infused into an external Apollo electrospray ion source at a flow rate of 13 μl/min with the assistance of N2 nebulizing gas. The off-axis sprayer was grounded, and the inlet capillary was set to 1.7 kV for generation of oligonucleotide anions. N2 drying gas was applied to assist desolvation of ESI droplets. Ions were accumulated in the hexapole for 0.2 s. All data were acquired in negative ion mode and processed using XMASS 6.0.1 (Bruker Daltonics).
Electrophoretical analysis
Single-stranded DNAs were radiolabeled at the 5′-end with [γ-32P]ATP using polynucleotide kinase before annealing. The 5′-labeled duplexes (10 nM) were incubated with CTD or king of DNA (KOD) polymerase (TOYOBO, Osaka, Japan) in a 50 mM Tris–HCl (pH 7.5) containing 100 mM KCl, 5 mM MgCl2 and 25 μM non-labeled substrate dsDNA for 16 h at 37°C. The enzyme concentrations are indicated in the legends to figures. Reactions were stopped with the addition of equal volume of phenol–chloroform solution and the solutions were centrifuged at 15 000 r.p.m. for 10 min. The supernatants were mixed with the sample buffer (5 mM EDTA, 80% deionized formamide, 10 mM NaOH, 0.1% bromophenol blue and 0.1% xylene cyanol) and heat-treated at 95°C for 5 min. They were loaded onto 11% polyacrylamide sequencing gels (8 M urea and ×1 TBE buffer, 89 mM Trisborate and 2 mM EDTA) and electrophoresed with × 1 TBE buffer. The gels were dried and placed in contact with an imaging plate. The bands were visualized and analyzed using a BAS2500 image analyzer (Fuji Film, Tokyo, Japan).
The substrate 32P-labeled DNA was base-specifically modified and digested according to the Maxam–Gilbert method (21). In order to determine the length of the product DNA, these fragments were mixed with the sample buffer and electrophoresed along with the products on DNA sequencing gels.
RESULTS AND DISCUSSION
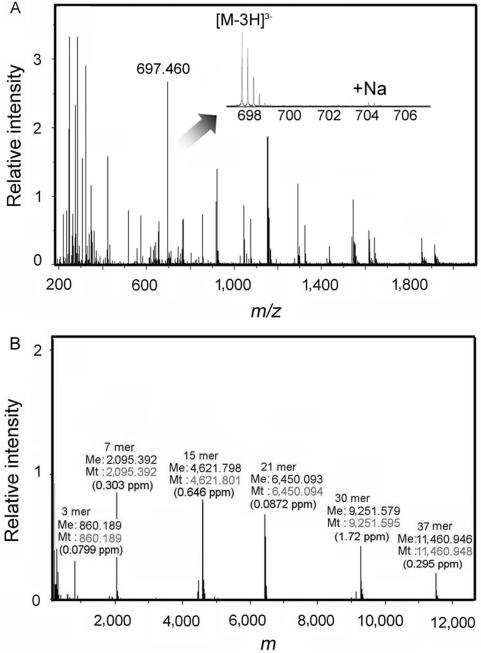
First, we examined the validity of our method for the purification of DNA samples. Contamination of non-volatile salts such as sodium or potassium, which would otherwise prevent ionization of the biomolecules and cause the formation of series of metal adduct ions (22), must be avoided. The single-stranded DNAs (ssDNAs) (3–30-mer) were prepared and analyzed as described in MATERIALS AND METHODS section. Raw mass spectra consisted of a series of peaks, corresponding to multiply charged ions of intact ssDNA having a specific number of protons removed from the phosphodiester groups (Figure 1A). As shown in inset, few metal adduct ion species were observed, showing the efficacy of the purification method. When the same sample was purified by ethanol precipitation, even the charged ions of ssDNA were hardly detected (data not shown) probably because non-volatile salts were poorly removed. In Figure 1B, signals representing the same DNA were deconvoluted to yield the molecular mass of the corresponding DNA. Comparison of the measured molecular mass against theoretical molecular mass enabled the length and sequence of the DNA species to be identified. A deviation between the measured and theoretical molecular mass of within ±2 p.p.m. was deemed acceptable. Our results show that the DNA desalting method can be applied to the analysis of extremely short oligonucleotides, at least to a 3-mer.
Figure 1.
ESI–FT ICR MS analysis of ssDNAs. (A) The raw mass spectra of 3, 7, 15, 21, 30 and 37-mer ssDNAs. The synthesized ssDNAs (3′-hydroxylated) were suspended in the reaction buffer without protein and purified according to the protocol described in MATERIALS AND METHODS section. Labeled peak (697.460) is corresponding to 7-mer ssDNA having three protons removed ([M-3H]3–). Inset shows the isotopic cluster for [M-3H]3– and their sodium adduct ion peaks. (B) The deconvoluted mass spectra of the ssDNAs. The length, measured mass (Me), theoretical mass (Mt) and deviation between measured and theoretical mass are indicated at the top of each peak.
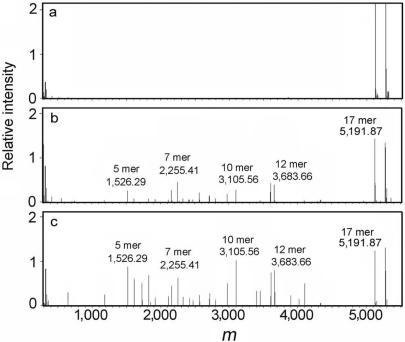
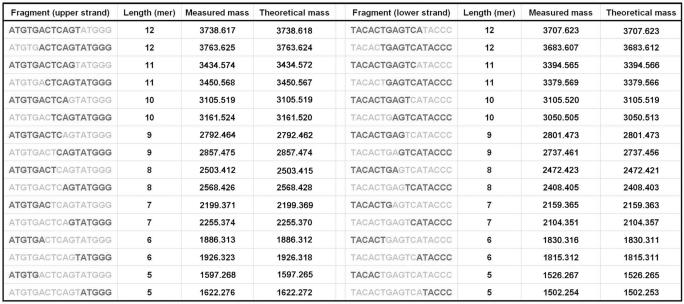
The 5′-phosphorylated 17-bp dsDNA incubated with CTD were analyzed as described above. We chose the oligonucleotide sequence shown in MATERIALS AND METHODS section as a substrate since it has left–right asymmetric nucleotide content. Symmetric distribution of the nucleotide content will cause difficulty in identification of the fragments since various potential structures correspond to a single mass. Figure 2 shows the deconvoluted mass spectra of reaction products. The substrate and product dsDNAs are completely denatured and detected as ssDNAs. Indeed, any remaining dsDNAs would have complicated the interpretation of the results. An increased number of peaks corresponding to DNA reaction products were detected as the enzyme concentration increased. Several peaks are more abundant than others. However, we cannot quantitatively interpret this in terms of selectivity because the nucleotide content and length seems to have an effect on the ionization efficiency of oligonucleotides (data not shown). Over 90% of these peaks were accurately identified as 5–12-mer fragments. The major fragments identified by mass spectrometric analysis are listed in Figure 3. This result strongly suggests that the nuclease activity of CTD has no obvious sequence-specificity. All of mass spectrometric analyses were performed in triplicate.
Figure 2.
ESI–FT ICR MS analysis of reaction products. The substrate dsDNA was reacted with 0 (A), 100 (B) or 200 (C) nM CTD. The products were purified according to the protocol described in MATERIALS AND METHODS section. The deconvoluted spectra of reacted products of 5′-phosphorylated 17-bp dsDNA were shown. For clarity, information concerning the length and measured mass of the major species are shown above the corresponding peaks.
Figure 3.
The major products of 5′-phosphorylated dsDNA identified by ESI–FT ICR MS. Identified fragments are indicated in dark gray. Theoretical masses were calculated assuming that CTD hydrolyzes a phosphodiester bond at 5′-side of a phosphate.
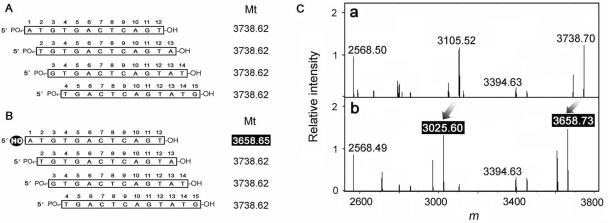
There were a few unidentified fragments that corresponded in mass to two or more candidate fragments (Figure 4A). Some of these peaks were subsequently identified by comparison with the result of a digestion of 5′-hydroxylated dsDNA (Figure 4B). When the fragment contained an unreacted 5′-terminus, the corresponding peak would shift as far as the difference between masses of hydroxyl and phosphoryl groups. As shown in Figure 3C, several peaks shifted and were identified.
Figure 4.
Identification of the precise structure of the reaction products. (A) There are several potential structures corresponding to a single mass. Theoretical masses (Mt) are indicated to the right of each DNA fragment. (B) 5′-modification of the substrate enables the precise structure of the corresponding product peak to be determined. For example, if CTD hydrolyzes a phosphodiester bond at the 5′-side of a phosphate, only one kind of 12-mer fragment (whose theoretical mass is highlighted) will retain a hydroxyl moiety at the 5′-end. (C) Comparison of the deconvoluted mass spectra of products generated from 5′-phosphorylated (a) and hydroxylated (b) substrates. Arrows indicates the shifted masses. Differences in the masses are almost identical to the difference in the mass of the phosphoryl and hydroxyl groups.
All of the theoretical masses used to identify the peaks were calculated by assuming the 5′- and 3′-termini of cleaved sites were phosphorylated and hydroxylated, respectively. These results indicate that CTD incised the phosphate backbone of oligodeoxynucleotides at the 3′ side of the phosphates and the nicks generated by CTD could be ligated by DNA ligase. Thus, ESI–FT ICR MS can identify the nature of the cleaved sites with considerable accuracy.
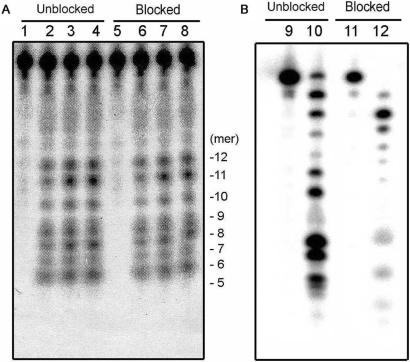
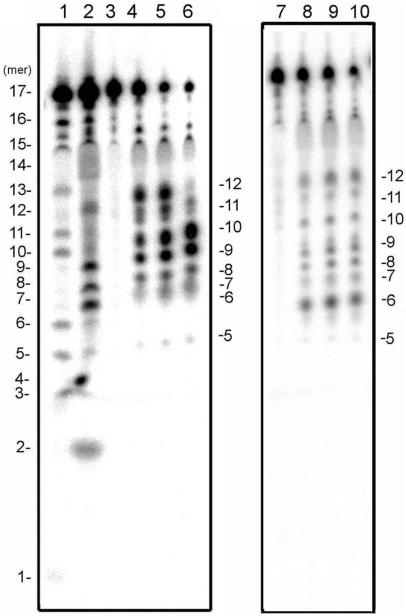
The nuclease activity for 17-bp dsDNA was also examined by electrophoretic analysis using a sequencing gel. As shown in Figure 6, the fragments were estimated to be 5–12-mers by comparison to the DNA size marker made by the Maxam–Gilbert method (21). These results are entirely consistent with the analysis by mass spectrometry. Although a few fragments shorter or longer than 5- or 12-mer were observed when the enzyme concentration was increased (data not shown), main products were always 5–12-mer fragments. This result indicates that a certain length of dsDNA is required for the formation of a stable CTD–substrate complex.
Figure 6.
CTD did not demonstrate a 3′–5′ exonuclease activity. The substrate dsDNA whose 3′-terminus was blocked or unblocked with LNA was incubated with CTD (A) or KOD polymerase (B) and subjected to electrophoresis on an 11% polyacrylamide sequencing gel. Lanes 1–4: unblocked substrates were digested with 0, 50, 100 or 200 nM CTD, respectively; lanes 5–8: blocked substrates were digested with 0, 50, 100 or 200 nM CTD, respectively; lanes 9 and 10: unblocked substrates were digested with 0 or 5 nM KOD polymerase; lanes 11 and 12: blocked substrates were digested with 0 or 5 nM KOD polymerase. The length of the product fragments (bases) are indicated by numbers to the right of panel A.
All of the detected fragments retained an unreacted 5′- or 3′-terminus, indicating that CTD possesses a non-sequence-specific endonuclease activity rather than exonuclease activity. Gel electrophoretic analysis also ruled out the possibility of 5′ to 3′ exonuclease activity of CTD because there was no observable accumulation of short fragments during the incision of 5′-labeled substrates (Figure 5). We then tested the oligonucleotide analog where the nucleotide at the 3′-terminal end was replaced with LNA, which contains an extra 2′-O, 4′-C-methylene bridge on the ribose ring. It had been reported that this substrate shows a tolerance to exonuclease activity (23,24). Although the 3′–5′ exonuclease activity of KOD polymerase was affected by the replacement of the 3′-terminal end, the replacement did not affect the nuclease activity of CTD (Figure 6). Taken together, electrophoretic analysis also demonstrated that CTD does not possess an exonuclease activity. Thus, we have confirmed the validity of the ESI–FT ICR mass spectrometric analysis.
Figure 5.
Electrophoretical analysis of the products. Upper (left) or lower (right) strand of 17-bp substrate dsDNA was 5′-radio labeled and reacted with indicated concentrations of CTD and subjected to electrophoresis on an 11% polyacrylamide sequencing gel. Lane 1: pyrimidine-specific sequence marker generated by Maxam–Gilbert method; lane 2: purine-specific marker; lane 3–6: upper strand labeled substrates were digested with 0, 50, 100 and 200 nM CTD, respectively; lane 7–10: lower strand labeled substrates were digested with 0, 50, 100 and 200 nM CTD, respectively. Numbers to the left and right of the gel indicate the length (bases) of the DNA seize markers and products, respectively.
The results in this study showed that ESI–FT ICR MS can precisely analyze the digestion pattern of a non-sequence-specific endonuclease. In comparison, the analysis of a sequence- or structure-specific endonuclease activity should be relatively straightforward using this methodology. The information about substrate specificity and the nature of cleaved sites would be a great help in understanding the mechanism of an enzyme and its role in a biological process. For example, when a newly discovered nuclease preferably incised at an abasic site yielding 5′-deoxyribosephosphate (5′-dRP) end, we should consider the possibility that the nuclease takes part in base excision repair through the repair of abasic sites and the repair pathway requires an enzyme that have a 5′-dRPase activity such as DNA polymerase β.
ACKNOWLEDGEMENTS
This work was supported in part by Grants-in-aid for Scientific Research to R.M. from the Ministry of Education, Science, Sports and Culture of Japan and by the RIKEN Structural Genomics/Proteomics Initiative (RSGI), the National Project on Protein Structural and Functional Analyses, Ministry of Education, Culture, Sports, Science and Technology of Japan. Funding to pay the Open Access publication charges for this article was provided by the RIKEN Structural Genomics/Proteomics Initiative.
Conflict of interest statement. None declared.
REFERENCES
- 1.Lieberk MR. The FEN-1 family of structure-specific nucleases in eukaryotic DNA replication, recombination and repair. Bioessays. 1997;19:233–240. doi: 10.1002/bies.950190309. [DOI] [PubMed] [Google Scholar]
- 2.West SC. Molecular views of recombination proteins and their control. Nat. Rev. Mol. Cell. Biol. 2003;4:435–445. doi: 10.1038/nrm1127. [DOI] [PubMed] [Google Scholar]
- 3.Grindley NF, Whiteson KL, Rice PA. Mechanism of site-specific recombination. Annu. Rev. Biochem. 2006;75:567–605. doi: 10.1146/annurev.biochem.73.011303.073908. [DOI] [PubMed] [Google Scholar]
- 4.Marti TM, Fleck O. DNA repair nucleases. Cell. Mol. Life. Sci. 2004;61:336–354. doi: 10.1007/s00018-003-3223-4. [DOI] [PMC free article] [PubMed] [Google Scholar]
- 5.Andersen JS, Svensson B, Roepstorff P. Electrospray ionization and matrix assisted laser desorption/ionization mass spectrometry: powerful analytical tools in recombinant protein chemistry. Nat. Biotechnol. 1996;14:449–457. doi: 10.1038/nbt0496-449. [DOI] [PubMed] [Google Scholar]
- 6.Little DP, Thannhauser TW, McLafferty FW. Verification of 50- to 100-mer DNA and RNA sequences with high-resolution mass spectrometry. Proc. Natl Acad. Sci. USA. 1995;92:2318–2322. doi: 10.1073/pnas.92.6.2318. [DOI] [PMC free article] [PubMed] [Google Scholar]
- 7.Oberacher H, Niederstatter H, Parson W. Liquid chromatography-electrospray ionization mass spectrometry for simultaneous detection of mtDNA length and nucleotide polymorphisms. Int. J. Leg. Med. 2006;121:57–67. doi: 10.1007/s00414-006-0117-7. [DOI] [PubMed] [Google Scholar]
- 8.Null AP, Muddiman DC. Perspectives on the use of electrospray ionization fourier transform ion cyclotron resonance mass spectrometry for short tandem repeat genotyping in the post-genome era. J. Mass Spectrom. 2001;36:589–606. doi: 10.1002/jms.172. [DOI] [PubMed] [Google Scholar]
- 9.Eisen JA. A phylogenomic study of the MutS family of proteins. Nucleic Acids Res. 1998;26:4291–4300. doi: 10.1093/nar/26.18.4291. [DOI] [PMC free article] [PubMed] [Google Scholar]
- 10.Modrich P. Methyl-directed DNA mismatch correction. J. Biol. Chem. 1989;264:6597–6600. [PubMed] [Google Scholar]
- 11.Snowden T, Acharya S, Butz C, Berardini M, Fishel R. hMSH4-hMSH5 recognizes Holliday junctions and forms a meiosis-specific sliding clamp that embraces homologous chromosomes. Mol. Cell. 2004;15:437–451. doi: 10.1016/j.molcel.2004.06.040. [DOI] [PubMed] [Google Scholar]
- 12.Pinto AV, Mathieu A, Marsin S, Veaute X, Ielpi L, Labigne A, Radicella JP. Suppression of homologous and homeologous recombination by the bacterial MutS2 protein. Mol. Cell. 2005;17:113–120. doi: 10.1016/j.molcel.2004.11.035. [DOI] [PubMed] [Google Scholar]
- 13.Kang J, Huang S, Blaser MJ. Structural and functional divergence of MutS2 from Bacterial MutS1 and eukaryotic MSH4-MSH5 homologs. J. Bacteriol. 2005;187:3528–3537. doi: 10.1128/JB.187.10.3528-3537.2005. [DOI] [PMC free article] [PubMed] [Google Scholar]
- 14.Molloy S. MutS2: key to diversity? Nat. Rev. Microbiol. 2005;3:191. [Google Scholar]
- 15.Wang G, Alamuri P, Humayun MZ, Taylor DE, Maier J. The Helicobacter pylori MutS protein confers protection from oxidative DNA damage. Mol. Microbiol. 2005;58:166–176. doi: 10.1111/j.1365-2958.2005.04833.x. [DOI] [PubMed] [Google Scholar]
- 16.Fukui K, Masui R, Kuramitsu S. Thermus thermophilus MutS2, a MutS paralogue, possesses an endonuclease activity promoted by MutL. J. Biochem. 2004;135:375–384. doi: 10.1093/jb/mvh045. [DOI] [PubMed] [Google Scholar]
- 17.Fukui K, Kosaka H, Kuramitsu S, Masui R. Nuclease activity of the MutS Homologue MutS2 from Thermus thermophilus is confined to the Smr domain. Nucleic Acids Res. 2006;35:850–860. doi: 10.1093/nar/gkl735. [DOI] [PMC free article] [PubMed] [Google Scholar]
- 18.Moreira D, Philippe H. Smr: a bacterial and eukaryotic homologue of the C-terminal region of the MutS2 family. Trends Biochem. Sci. 1999;24:298–300. doi: 10.1016/s0968-0004(99)01419-x. [DOI] [PubMed] [Google Scholar]
- 19.Malik HS, Henikoff S. Dual recognition-incision enzymes might be involved in mismatch repair and meiosis. Trends Biochem. Sci. 2000;25:414–418. doi: 10.1016/s0968-0004(00)01623-6. [DOI] [PubMed] [Google Scholar]
- 20.Watanabe N, Wachi S, Fujita T. Identification and characterization of BCL-3-binding protein: implications for transcription and DNA repair or recombination. J. Biol. Chem. 2003;278:26102–26110. doi: 10.1074/jbc.M303518200. [DOI] [PubMed] [Google Scholar]
- 21.Gilbert W, Maxam A. The nucleotide sequence of the lac operator. Proc. Natl Acad. Sci. USA. 1973;70:3581–3584. doi: 10.1073/pnas.70.12.3581. [DOI] [PMC free article] [PubMed] [Google Scholar]
- 22.Loo RR, Dales N, Andrews PC. Surfactant effects on protein structure examined by electrospray ionization mass spectrometry. Protein Sci. 1994;3:1975–1983. doi: 10.1002/pro.5560031109. [DOI] [PMC free article] [PubMed] [Google Scholar]
- 23.Nielsen CB, Singh SK, Wengel J, Jacobsen JP. The solution structure of a locked nucleic acid (LNA) hybridized to DNA. J. Biomol. Struct. Dyn. 1999;17:175–191. doi: 10.1080/07391102.1999.10508352. [DOI] [PubMed] [Google Scholar]
- 24.Di Giusto DA, King GC. Strong positional preference in the interaction of LNA oligonucleotides with DNA polymerase and proofreading exonuclease activities: implications for genotyping assays. Nucleic Acids Res. 2004;32:e32. doi: 10.1093/nar/gnh036. [DOI] [PMC free article] [PubMed] [Google Scholar]


