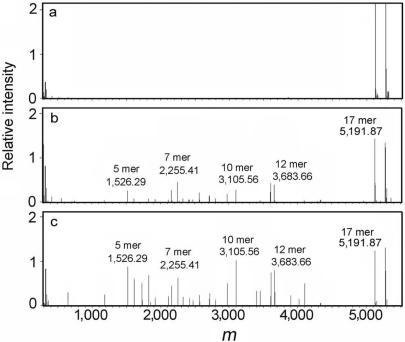
Figure 2.
ESI–FT ICR MS analysis of reaction products. The substrate dsDNA was reacted with 0 (A), 100 (B) or 200 (C) nM CTD. The products were purified according to the protocol described in MATERIALS AND METHODS section. The deconvoluted spectra of reacted products of 5′-phosphorylated 17-bp dsDNA were shown. For clarity, information concerning the length and measured mass of the major species are shown above the corresponding peaks.

