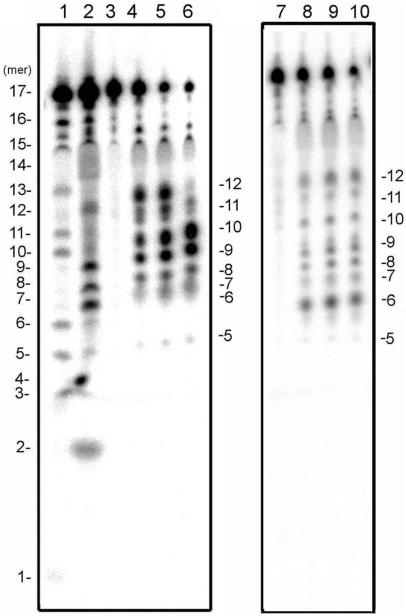
Figure 5.
Electrophoretical analysis of the products. Upper (left) or lower (right) strand of 17-bp substrate dsDNA was 5′-radio labeled and reacted with indicated concentrations of CTD and subjected to electrophoresis on an 11% polyacrylamide sequencing gel. Lane 1: pyrimidine-specific sequence marker generated by Maxam–Gilbert method; lane 2: purine-specific marker; lane 3–6: upper strand labeled substrates were digested with 0, 50, 100 and 200 nM CTD, respectively; lane 7–10: lower strand labeled substrates were digested with 0, 50, 100 and 200 nM CTD, respectively. Numbers to the left and right of the gel indicate the length (bases) of the DNA seize markers and products, respectively.

