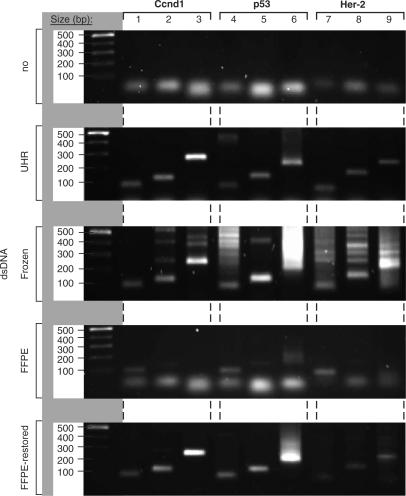
Figure 4.
The size of double-stranded DNA molecules is determined by PCR experiments. Size distribution of the PCR products on a 1% agarose gel. The first lane of each gel displays the ladder (500, 400, 300, 200 and 100 bp from top to bottom of gel). Lanes 1–9 show the PCR products from three primer pairs for Ccnd1, three primer pairs for p53 and three primer pairs for Her-2. Panel 1 shows PCR experiments performed without DNA, panel 2 with dsDNA generated from UHR RNA, panel 3 with dsDNA obtained from 10-year-old frozen RNA, panel 4 with dsDNA obtained from 10-year-old FFPE-RNA and panel 5 with dsDNA restored by CT-RT (See Supplementary Data for PCR details).

