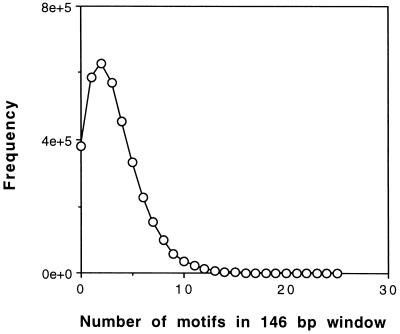
Figure 3.
Probability distribution for the number of occurrences within a nucleosome-sized window of the motif “(A or T)3NN(G or C)3NN,” where N is any base, averaged over the yeast genome. The plot is represented on a linear probability scale for ease of interpretation; a logarithmic plot (data not shown) better represents detail in the forward tail and again shows there to be a single peak at 2 on the abscissa. Only nonzero values are plotted; the last nonzero datapoint is at 25 on the abscissa. Many other motifs related to nucleosome packaging or positioning were also analyzed and yielded comparable results.

