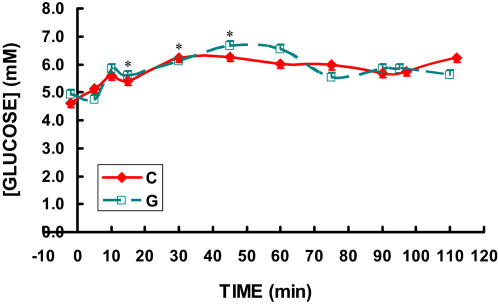
Figure 3. Time-course of blood glucose concentration while exercising at 62% for 90 minutes followed by exercise to exhaustion at 86% of VO2max during three C trials and two G trials.
The three C trials and two G trials were randomly ordered. Because no differences existed between trials, the data from the three C trials and two G trials were averaged. Data are means±SE. No difference existed between drinks. * significantly different from rest (p<0.05).

