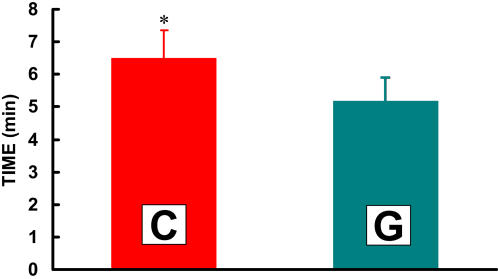
Figure 8. Time to exhaustion at 86% of VO2max after 90 minutes of cycling at 62% of VO2max while drinking either C or G.
C is the mean±SE of three trials. G is the mean±SE of two trials. Five trials total were carried out in random order. Time to exhaustion while drinking C was significantly longer (6.5±0.8 min) than while drinking G (5.2±1.0, p = 0.05).

