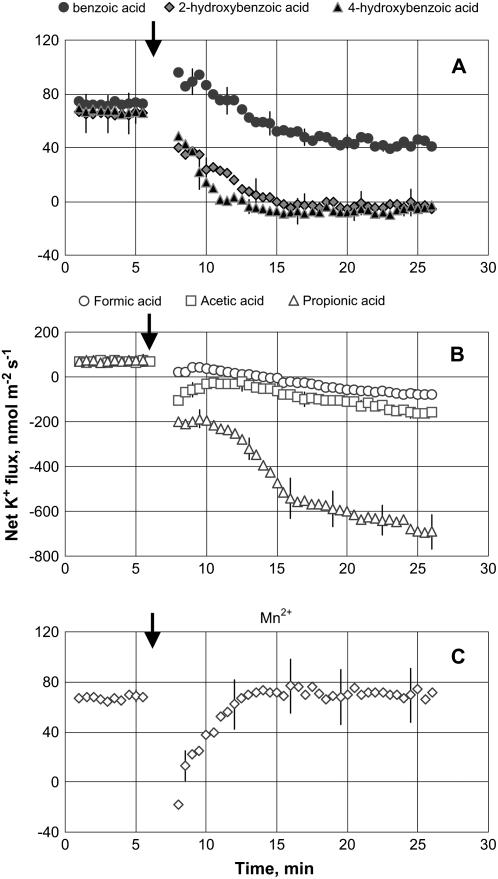
Figure 1.
K+ flux kinetics in response to secondary metabolites associated with anaerobic conditions (applied at the time indicated by an arrow). A, 200 μm phenolic acid treatment. B, 10 mm monocarboxylic acid treatment. C, 300 mg L−1 Mn2+ treatment. Measurements were made in the mature zone, 10 to 20 mm from the root tip. Data are means ± se (n = 8).

