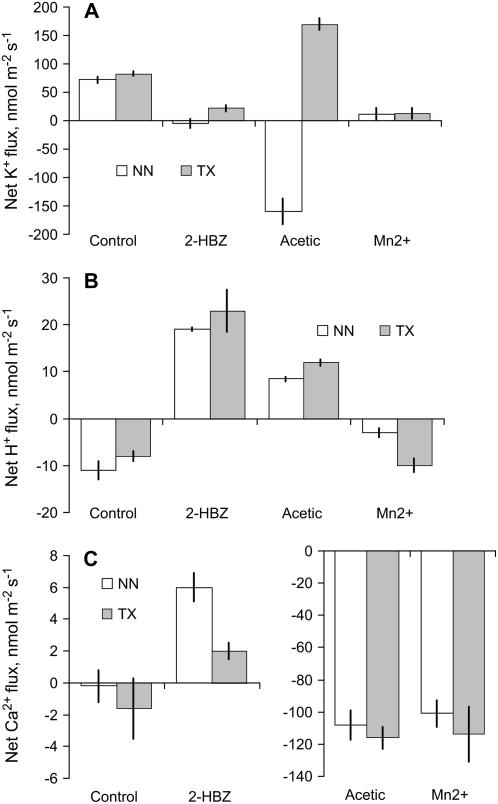
Figure 4.
Magnitude of net K+ (A), H+ (B), and Ca+ (C) responses to various metabolic compounds (as depicted in Figs. 1–3) for two genotypes contrasting in WL tolerance, 20 min after treatment. NN, ‘Naso Nijo’ (WL sensitive); ‘TX’, TX9425 (WL tolerant). Data are mean ± se (n = 8). 2-HBZ, 2-Hydroxybenzoic acid.

